4.1 Online survey findings

The data collected from our online surveys shows that people are more willing to share possessions, services or vehicles with people they spend time with and know rather than strangers. Individuals indicated that they trust vetted, regulated systems as well as those rated by other users, especially if the systems have internal or external monitoring methods. The main motivations people have for using sharing services are primarily convenience and access followed by value for money and low cost. Barriers to sharing were their concerns regarding cleanliness, personal safety and privacy. Regarding shared mobility, participants’ answers indicated that they perceived the key benefits to vehicle and ride sharing schemes are that they are better for the environment, use resources more efficiently, are cheaper, reduce congestion and are more socially responsible as well as offering value for money. When sharing a vehicle with strangers participants emphasised the need for adequate space between the users, some felt that screens or dividers could separate them and provide privacy, whilst others expressed the desire to have the opportunity to interact with others in the vehicle and socialise. A full summary of online survey results can be found in our report (click ‘DOWNLOAD FULL REPORT’ at the bottom of this webpage). 

4.1.1 Use of Shared Products and Services

The survey participants’ main motivations for using a service or product were convenience which received the highest responses in both surveys (70% survey one and 63% survey two). Value for money, access and low costs were also important to their motivations. Being ethically responsible motivated fewer of those taking part in survey one (3%) whilst 9% of survey two chose this, perhaps because most were older in this survey. 

4.1.2 Sharing with Others

When questioned what they were willing to share with people they knew, a majority from survey one would be very likely to share a journey – taxi service, Uber, etc. (55%), while the survey two participants were most likely to share tools – power tools, ladders, paint brushes etc. (46%). Regarding ‘sharing with people they don’t know’ several participants in survey one were likely to share a journey with strangers (49%), while in survey two were very unlikely to share a journey (46%) with people they don’t know. The top three barriers to sharing in both surveys were cleanliness, safety and privacy

4.1.3 Benefits and Concerns of Sharing vehicles

The key benefits of vehicle/ride sharing schemes perceived by survey one’s participants were better for the environment (71%), a better use of resources (70%), low cost (65%) and reduced congestion (55%), while in the second survey were the same but in different priorities: low costs (51%), better for the environment (40%) and reducing congestion (37%). The concerns people have about using shared mobility schemes are mostly about personal safety. The concern of not having when they needed a vehicle was the next highest concern in both surveys. A higher number of respondents on survey one (mostly female) said they would have trust if they could use an app to report any concerns to the regulator whilst travelling, or use an app to track their journey in real time or if the journey was monitored by the regulator

4.2 Findings from the user enactment workshops 

The workshops enabled us to gain insight into people’s general sharing experiences as well as their mobility sharing experiences both with people they knew, such as family, friends, colleagues or neighbours and with strangers. Some participants gave their perspective as drivers while others who don’t drive shared their passenger experiences instead. Their general sharing experiences included sharing accommodation, subscriptions and equipment. The most frequently mentioned short journeys they shared a vehicle either as a driver or passenger is commute, some described sharing journeys with family, friends and co-workers for longer trips such as holidays. Positive as well as negative experiences were described and participants spoke about how they felt on their journeys. Good feelings included community spirit, sociable, fun, entertaining and less agreeable feelings arose from disagreements and conflicts, weight of responsibility, feeling tired or not being comfortable. When talking about what they would like to change to make the current Uber like vehicle space more sharing friendly, the workshop participants indicated minor changes such as phone charger and charging pads, children’s booster seats, digital support and services such as selecting the route and being able to open passenger doors if the driver locked it. 

4.2.1 Storytelling and mapping

In asking the participants to share a story of their experiences of sharing, a general account of sharing things and various vehicle sharing memories, we gathered a wide range of examples illustrating diverse events. They also discussed what they liked or didn’t like about their particular sharing event which helped us to identify positive and negative themes connected to their stories. (click ‘DOWNLOAD FULL REPORT’ at the bottom of this webpage to see a full list of examples).

Positive themes that emerged from the storytelling session

The experience of sharing public transport in a foreign country is an unforgettable memory for one workshop participant as it became an out-of-the-ordinary event when the bus became stuck, resulting in the person sharing more interaction with the local people than before while they waited outside the vehicle for assistance. Sharing a commute can have positive economic benefits for those participants who travelled to work with a colleague or neighbours as well as for those using public transport and taxi services. The social side of sharing a vehicle as a driver and as a passenger was enjoyed by several participants as they described spending time talking with friends, family and students, listening to nostalgic music, sharing food as well as the journey, and that they felt part of a community. 

See Figure 16 that shows three keywords each participant chose to describe their positive thoughts on sharing.

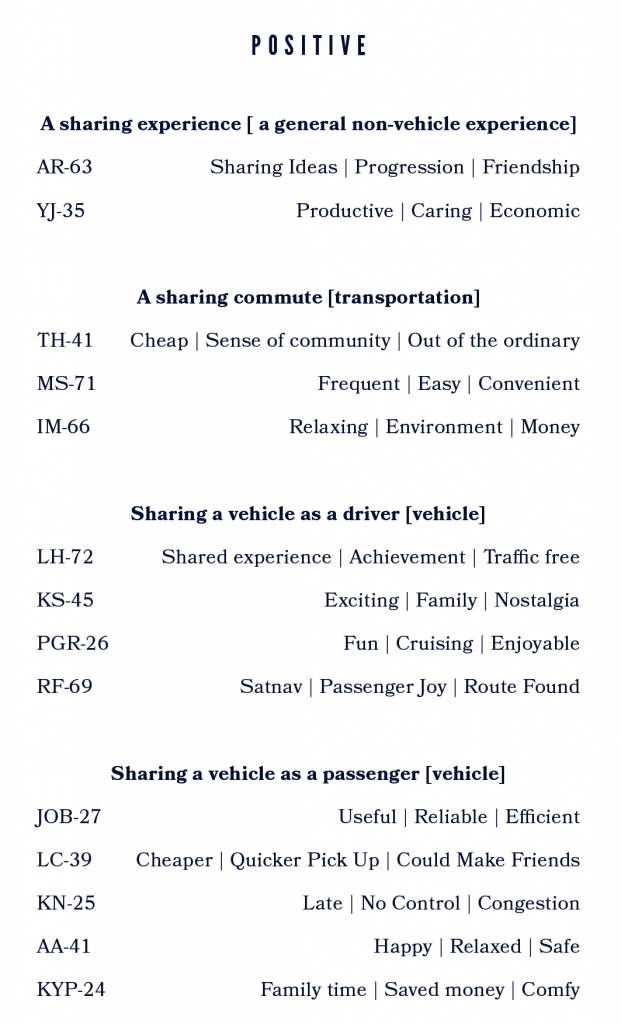
Fig 16. positive thoughts on sharing table

Negative themes that emerged from the storytelling session

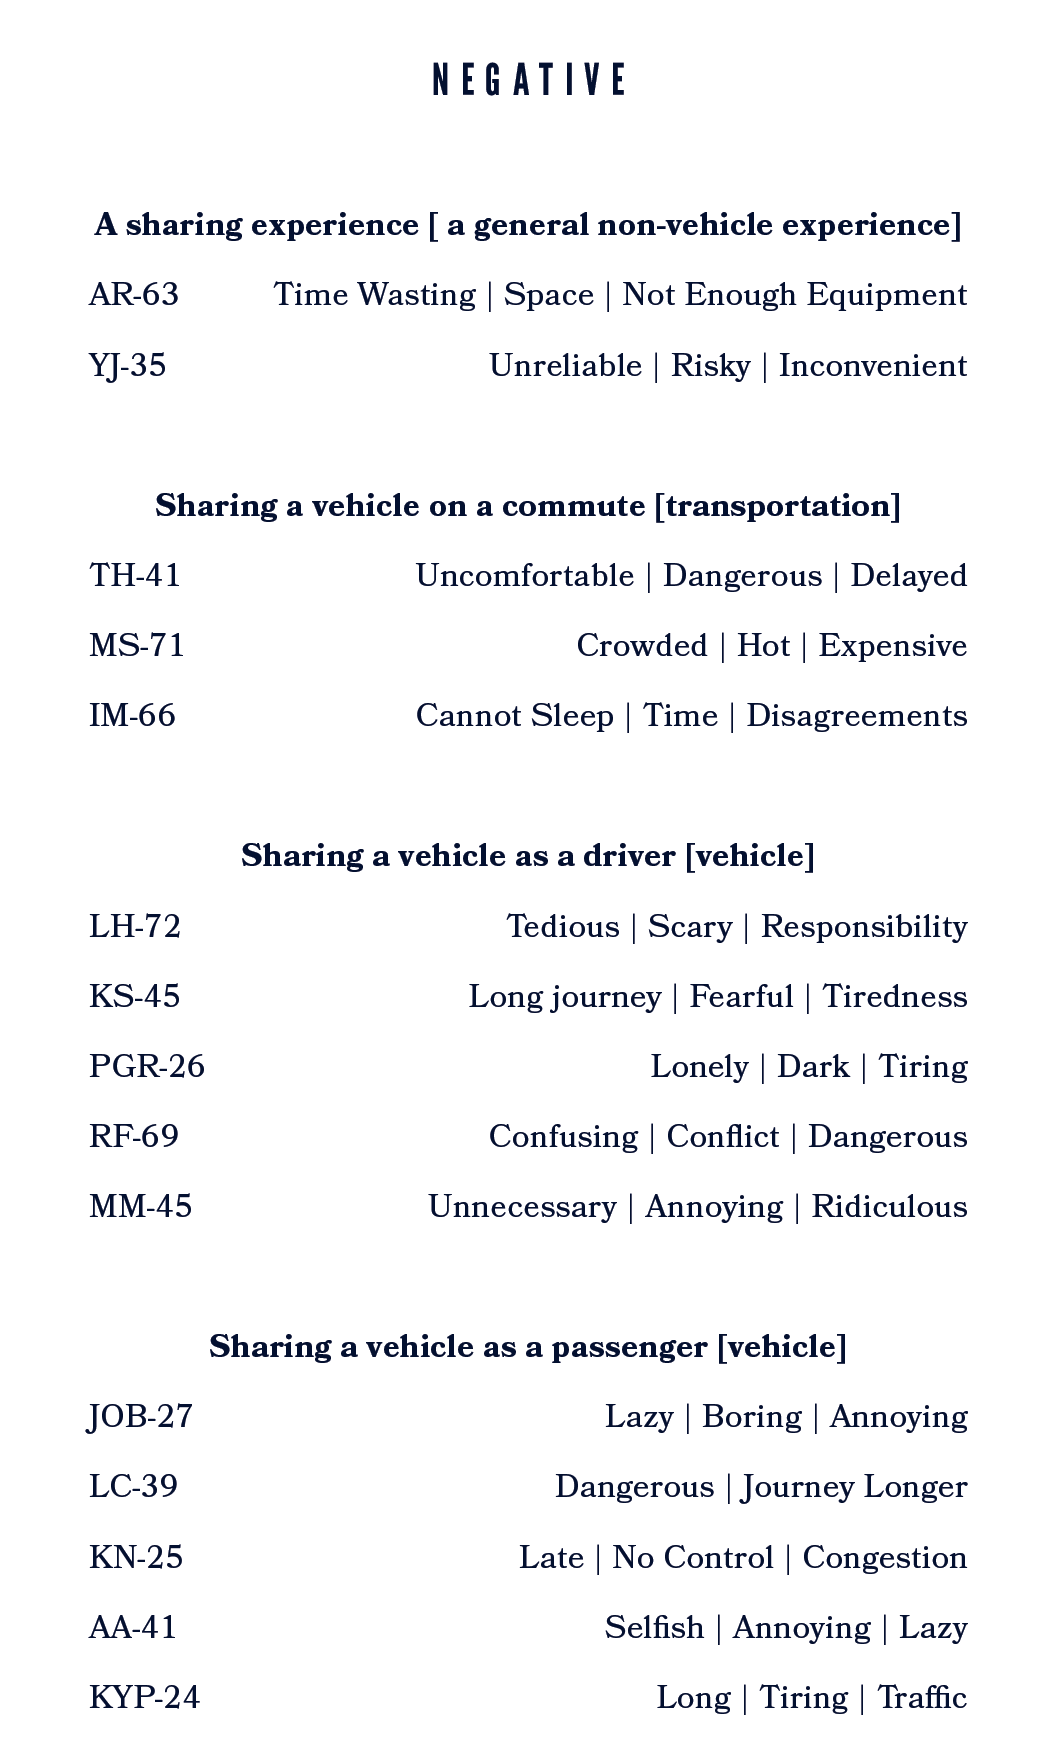
Some participants spoke of negative social behaviour experiences when talking about their shared journeys such as minor disagreements about things and being told off for chatting too much. Drivers felt responsible for their passengers and that they were relied on. There was a physical and mental toll including tiredness, needing to concentrate, it was hard work and isolating for them from the others in the vehicle. The negative aspects from a passenger point of view were safety concerns regarding the trustworthiness of both the driver and service and the risks associated. Social concerns were expressed regarding communication and compatibility with the other passengers, such as possible anti-social behaviour, too many others in the vehicle, disagreements, moody non-sociable passengers, no choice with other users, too much conversation or a lack of conversation. These issues resulted in some participants feeling it was inconvenient, annoying and not relaxing.

See Figure 17 that shows three keywords each participant chose to describe their negative thoughts on sharing.
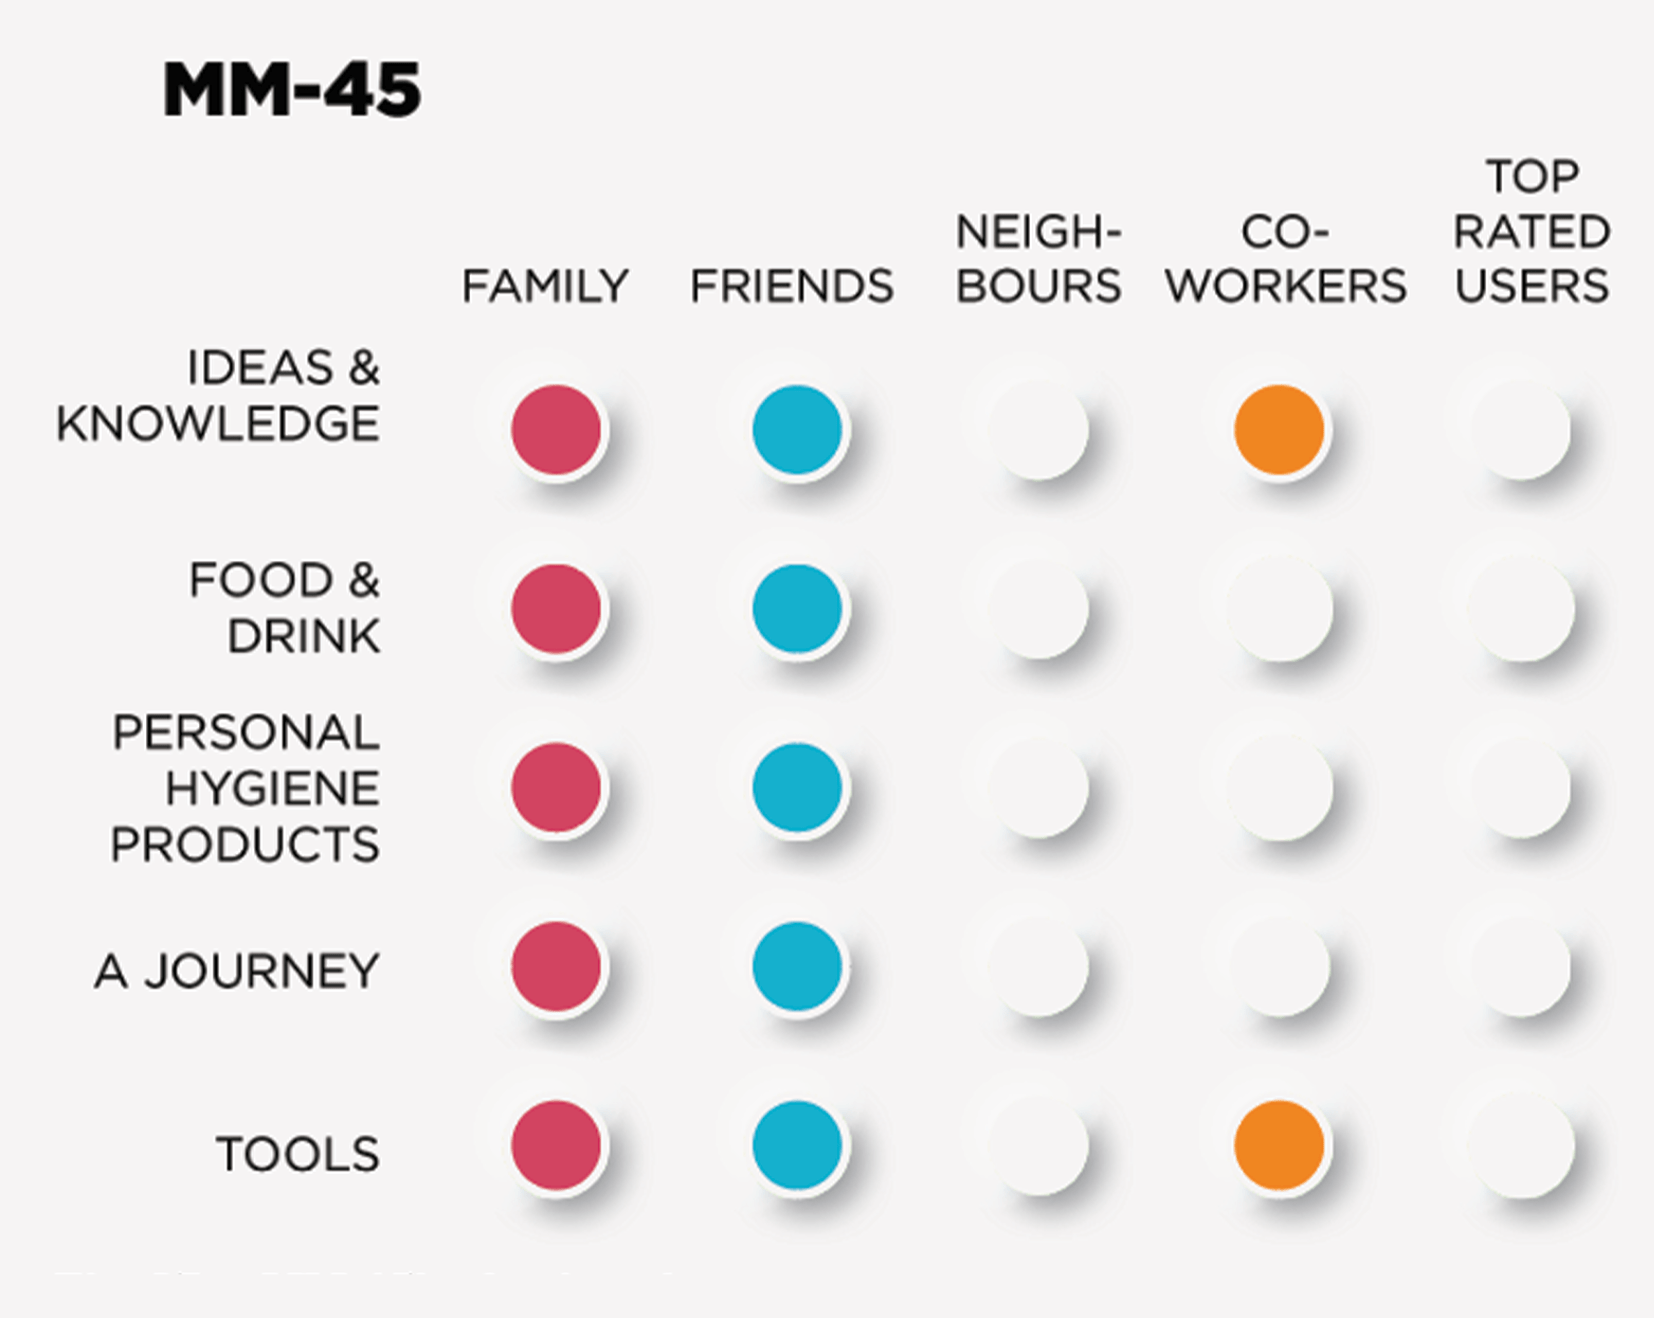
Fig 17. negative thoughts on sharing table

4.2.2 Tribal mapping

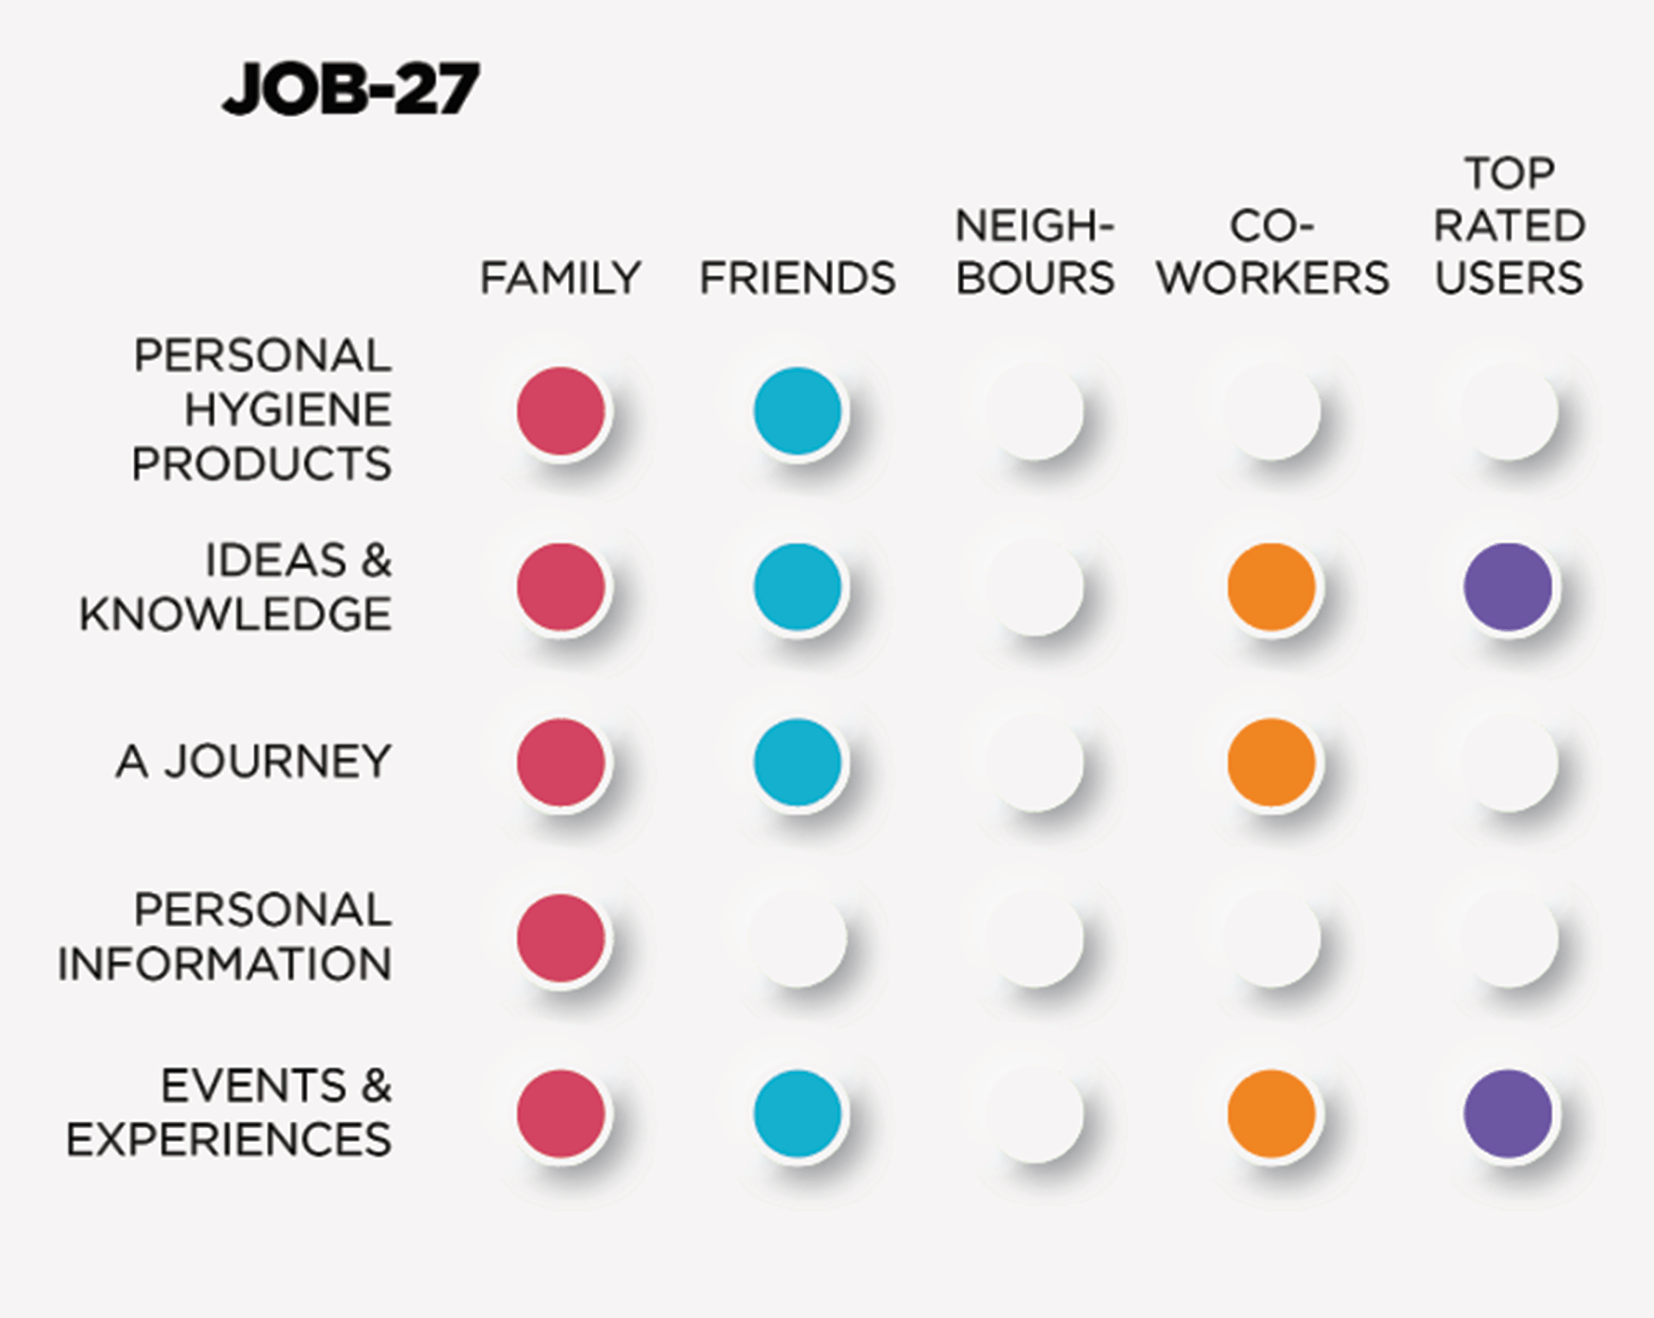
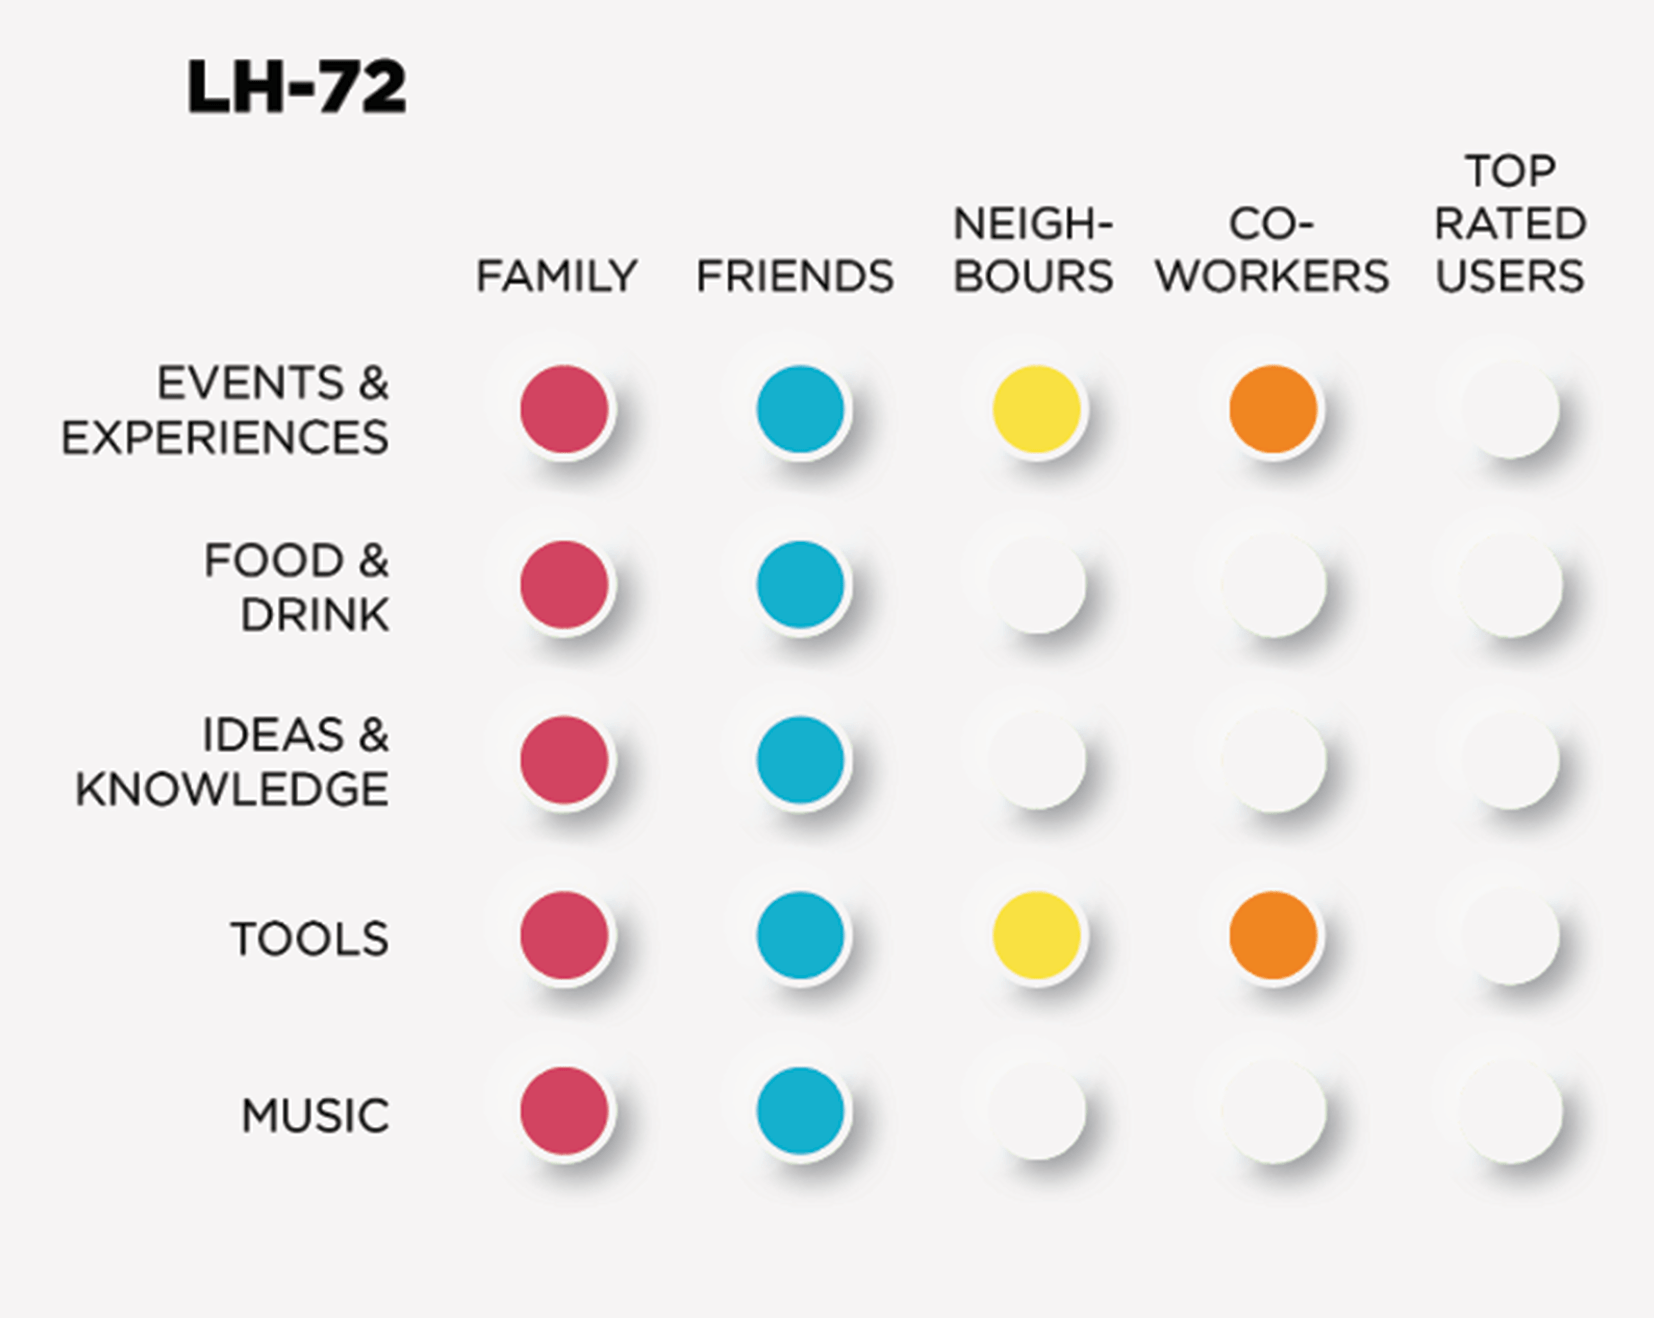
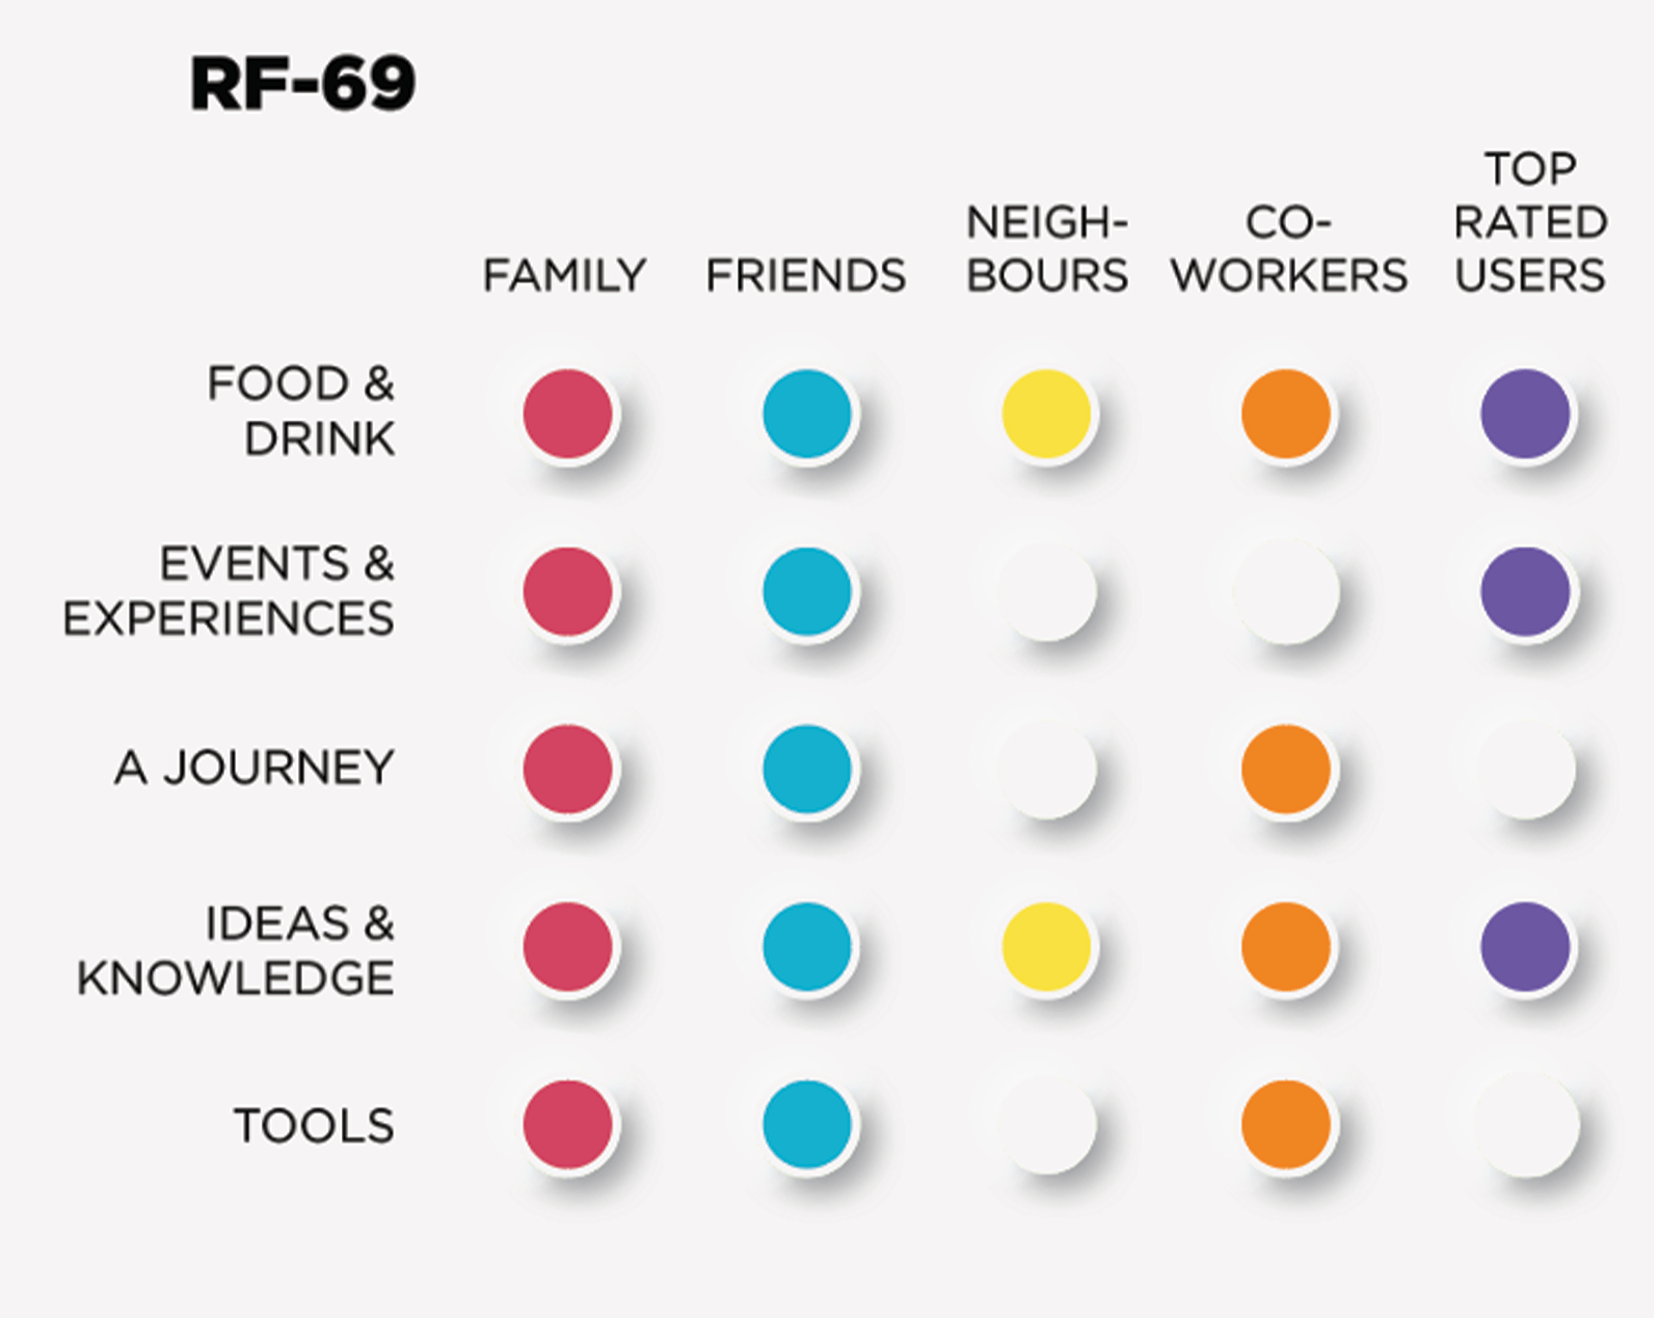
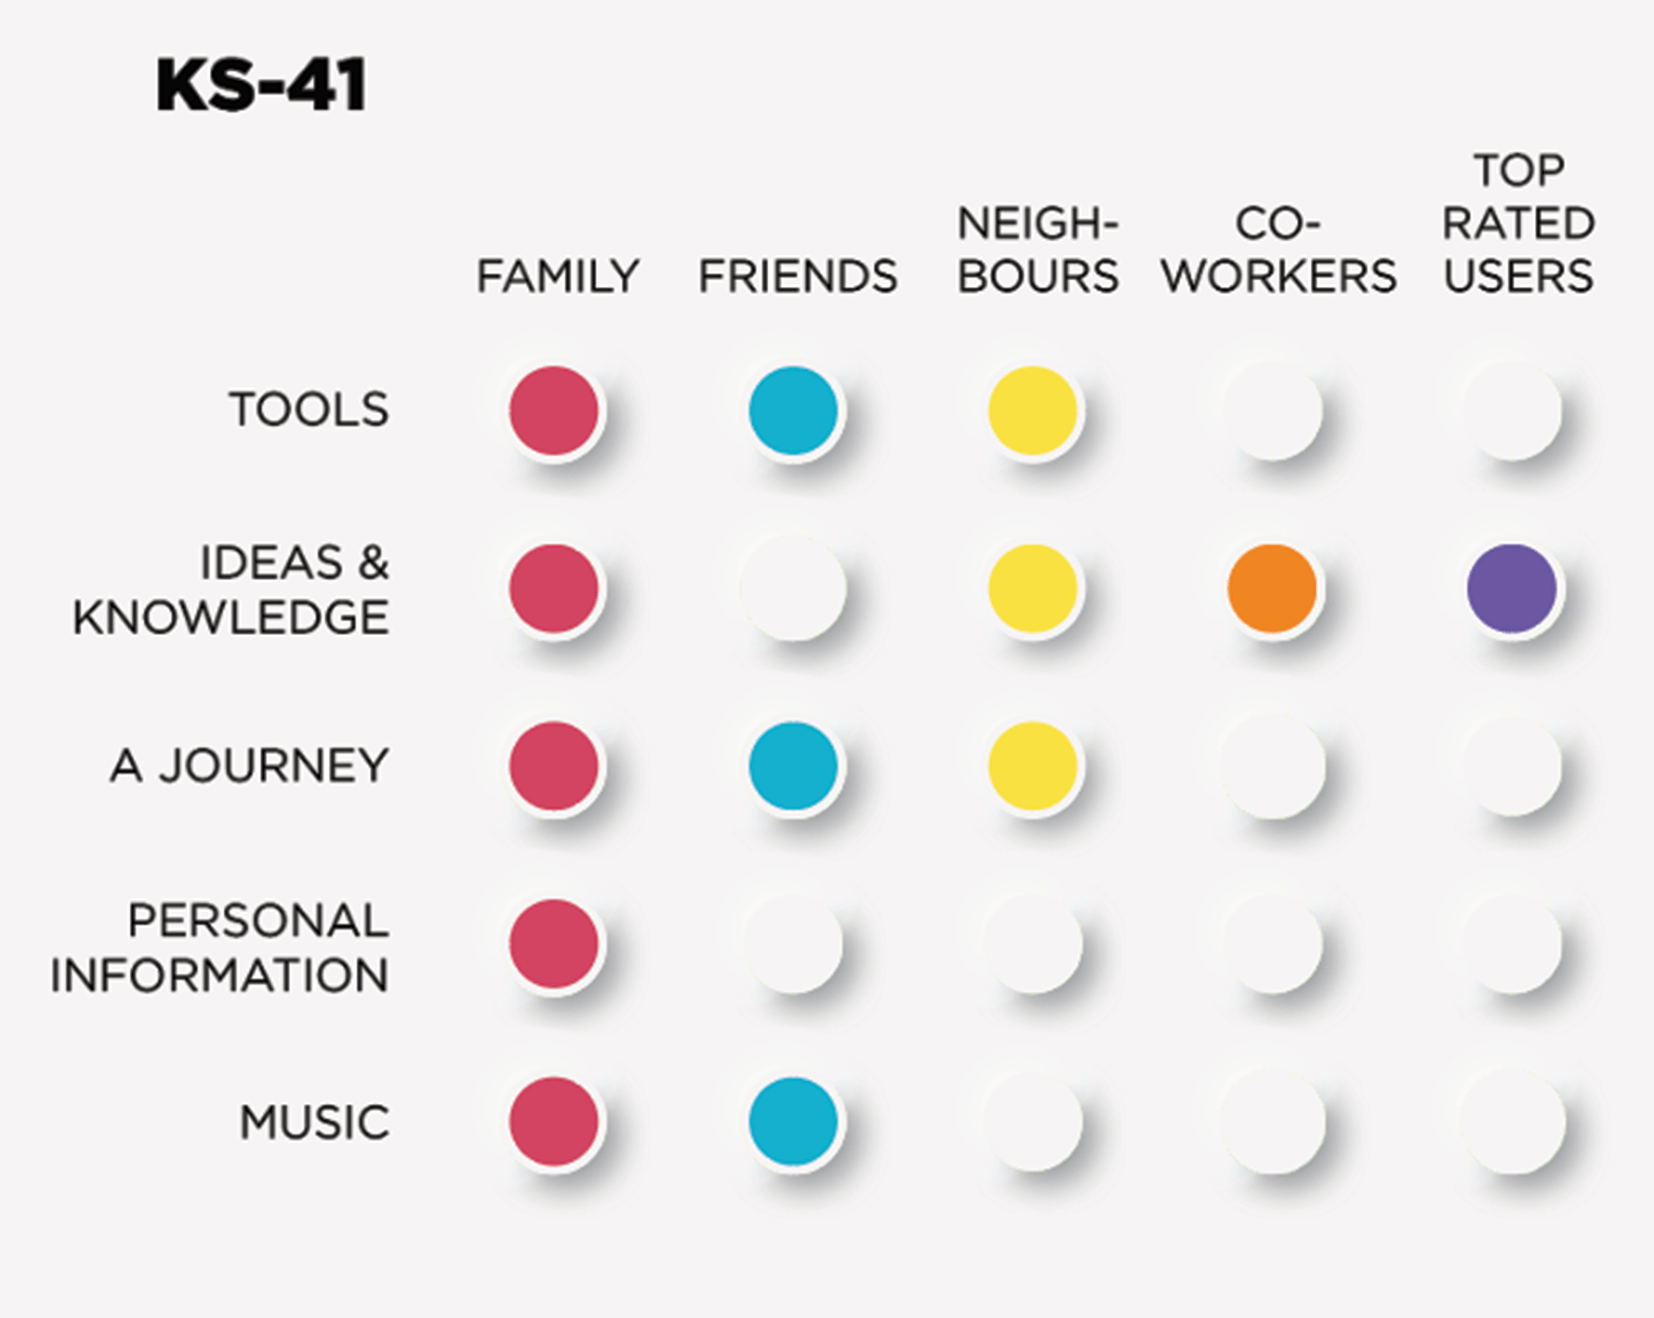
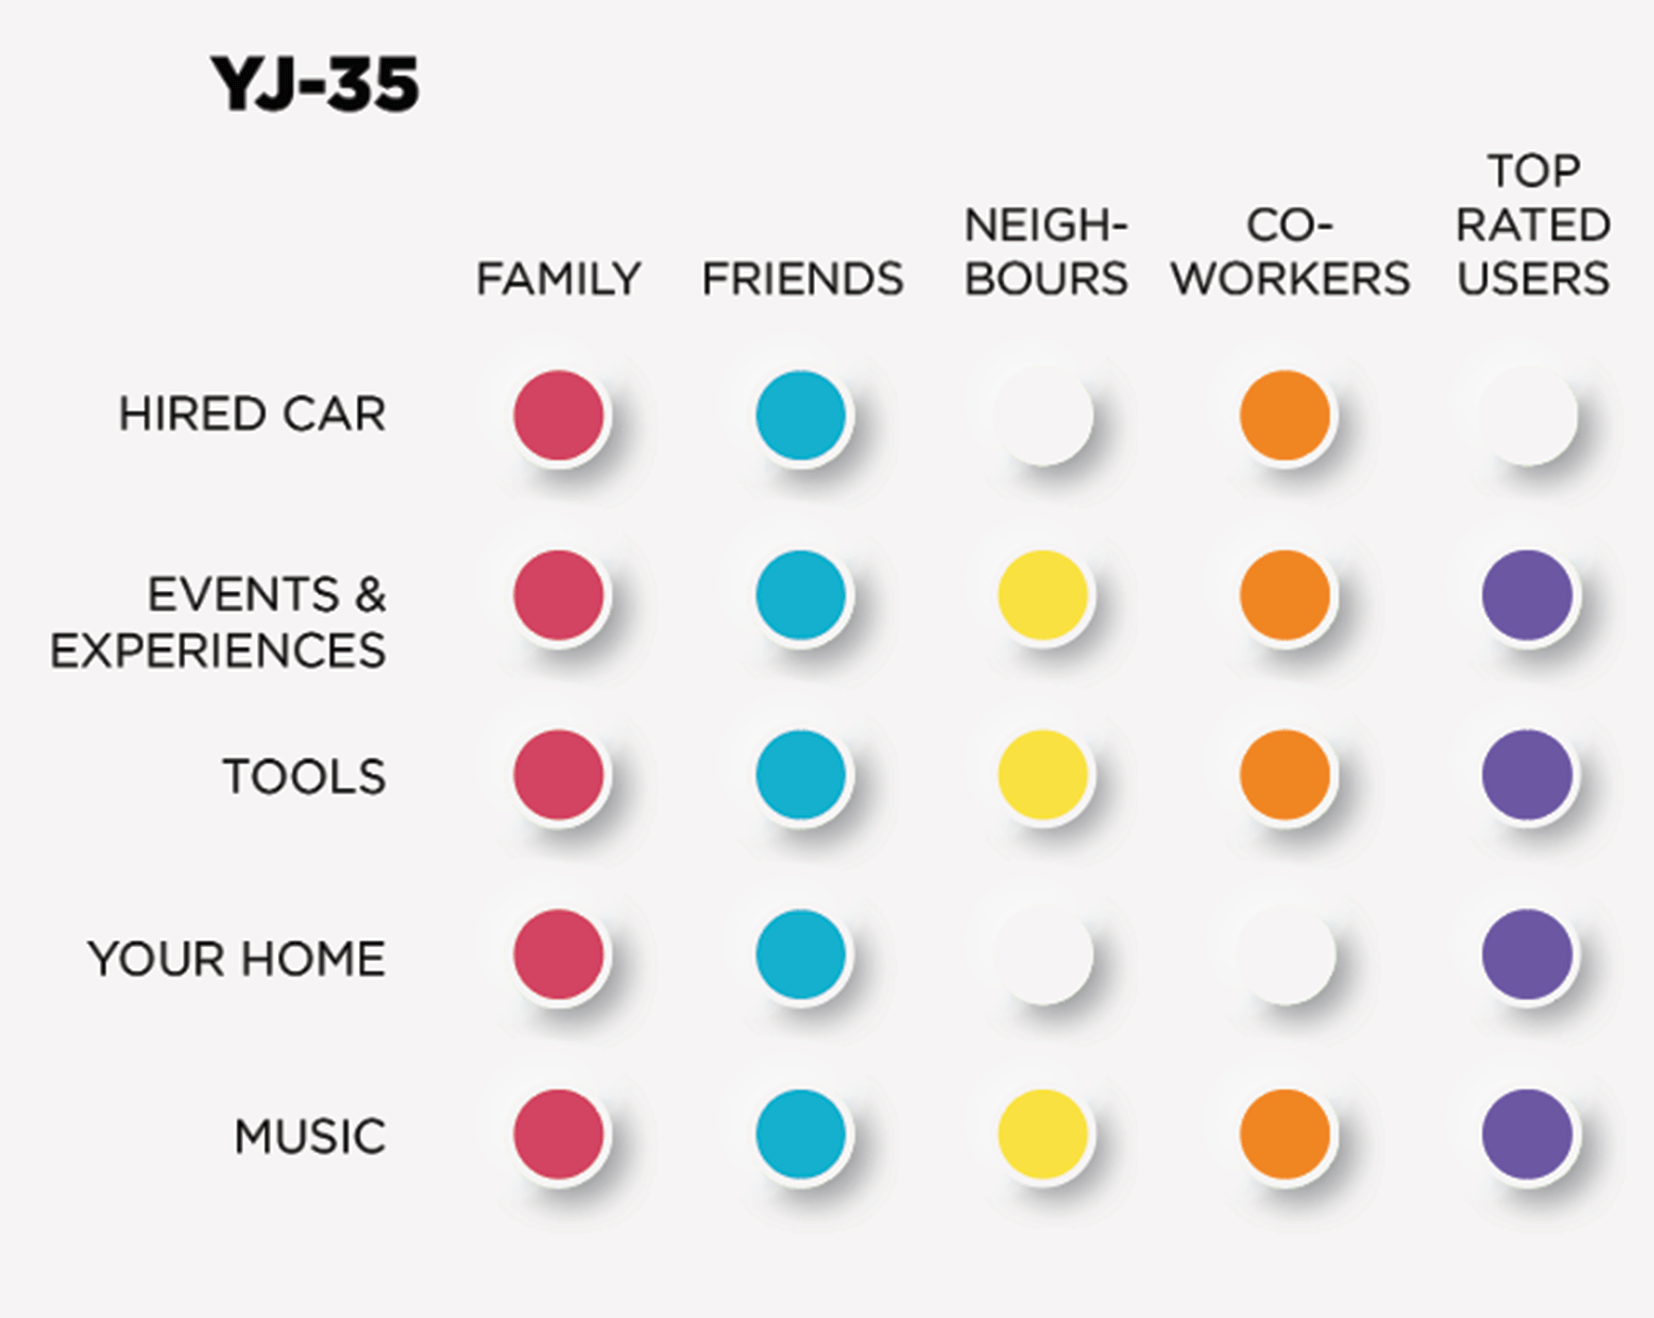
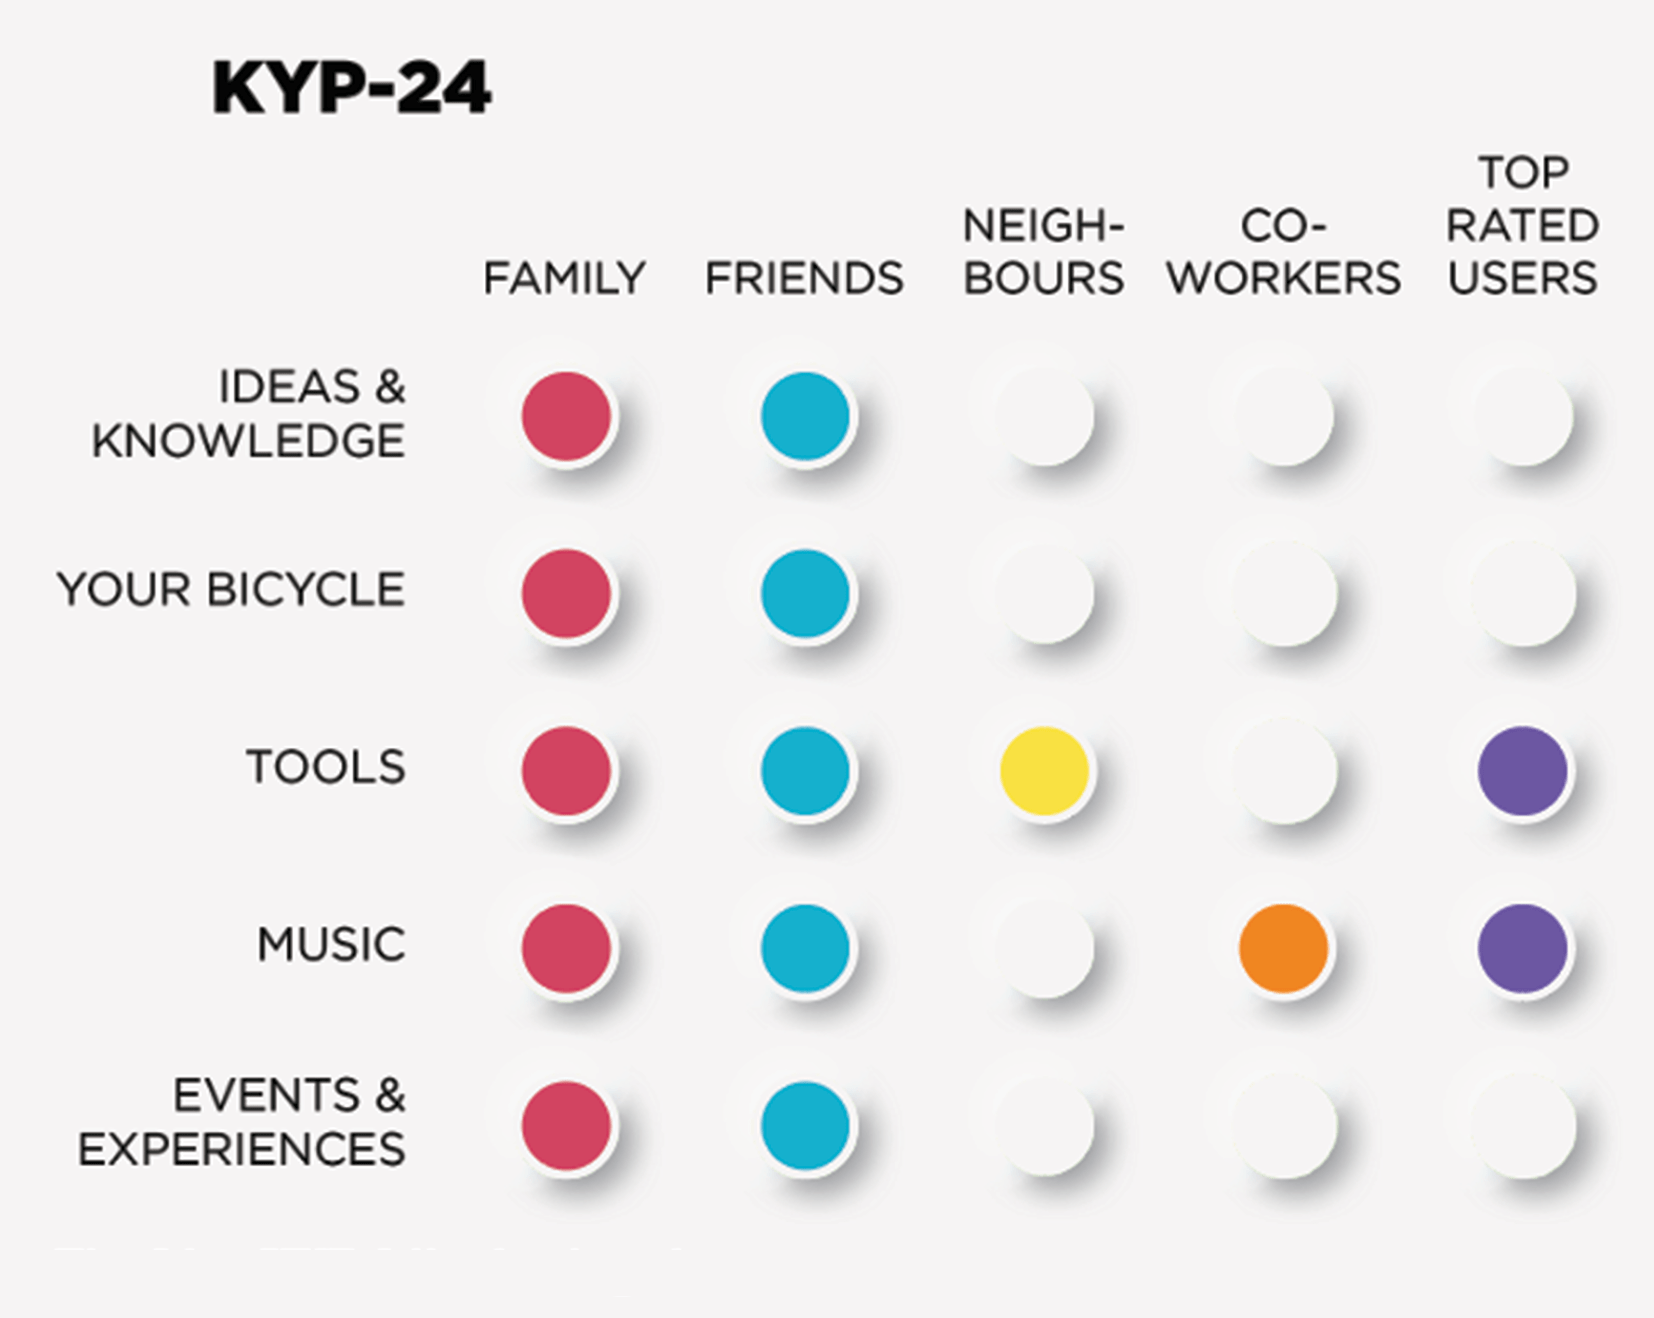
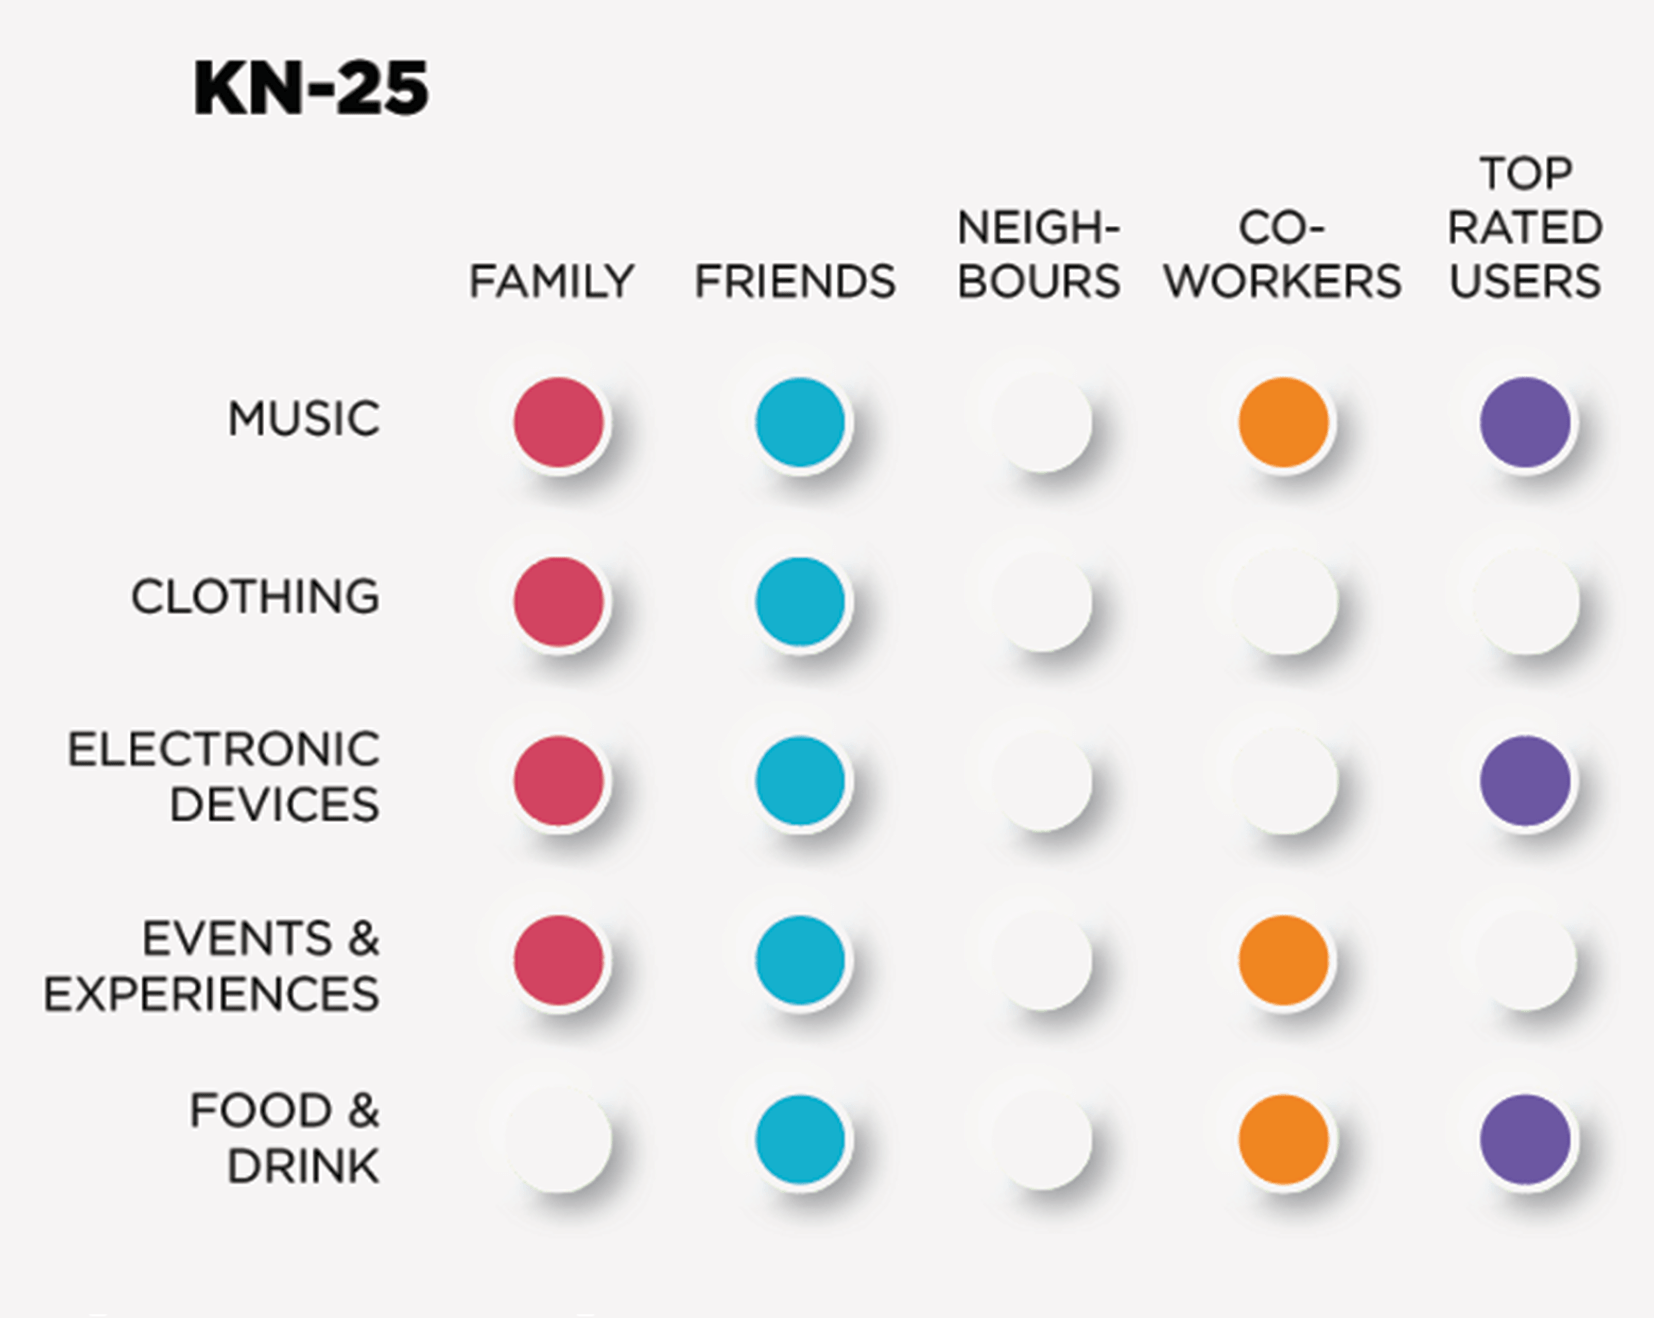
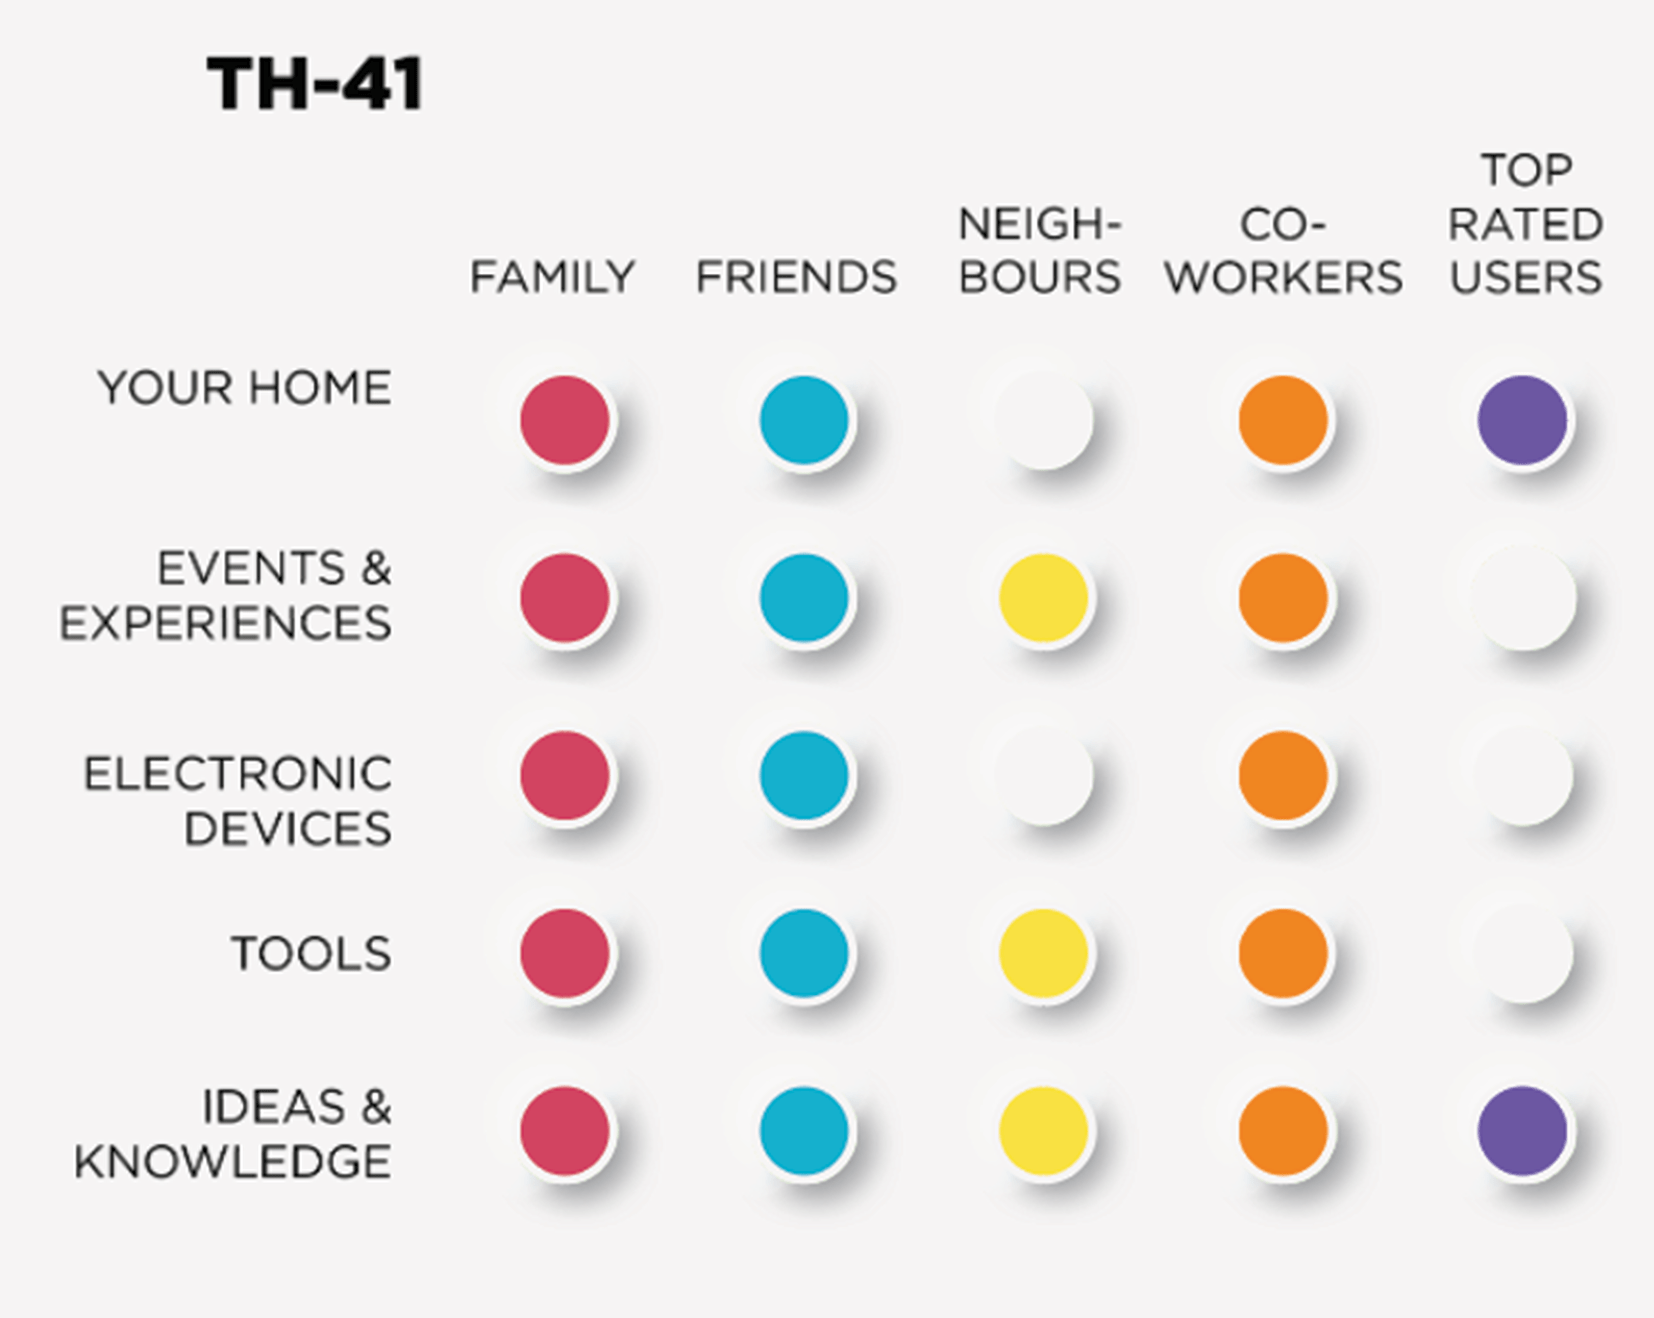
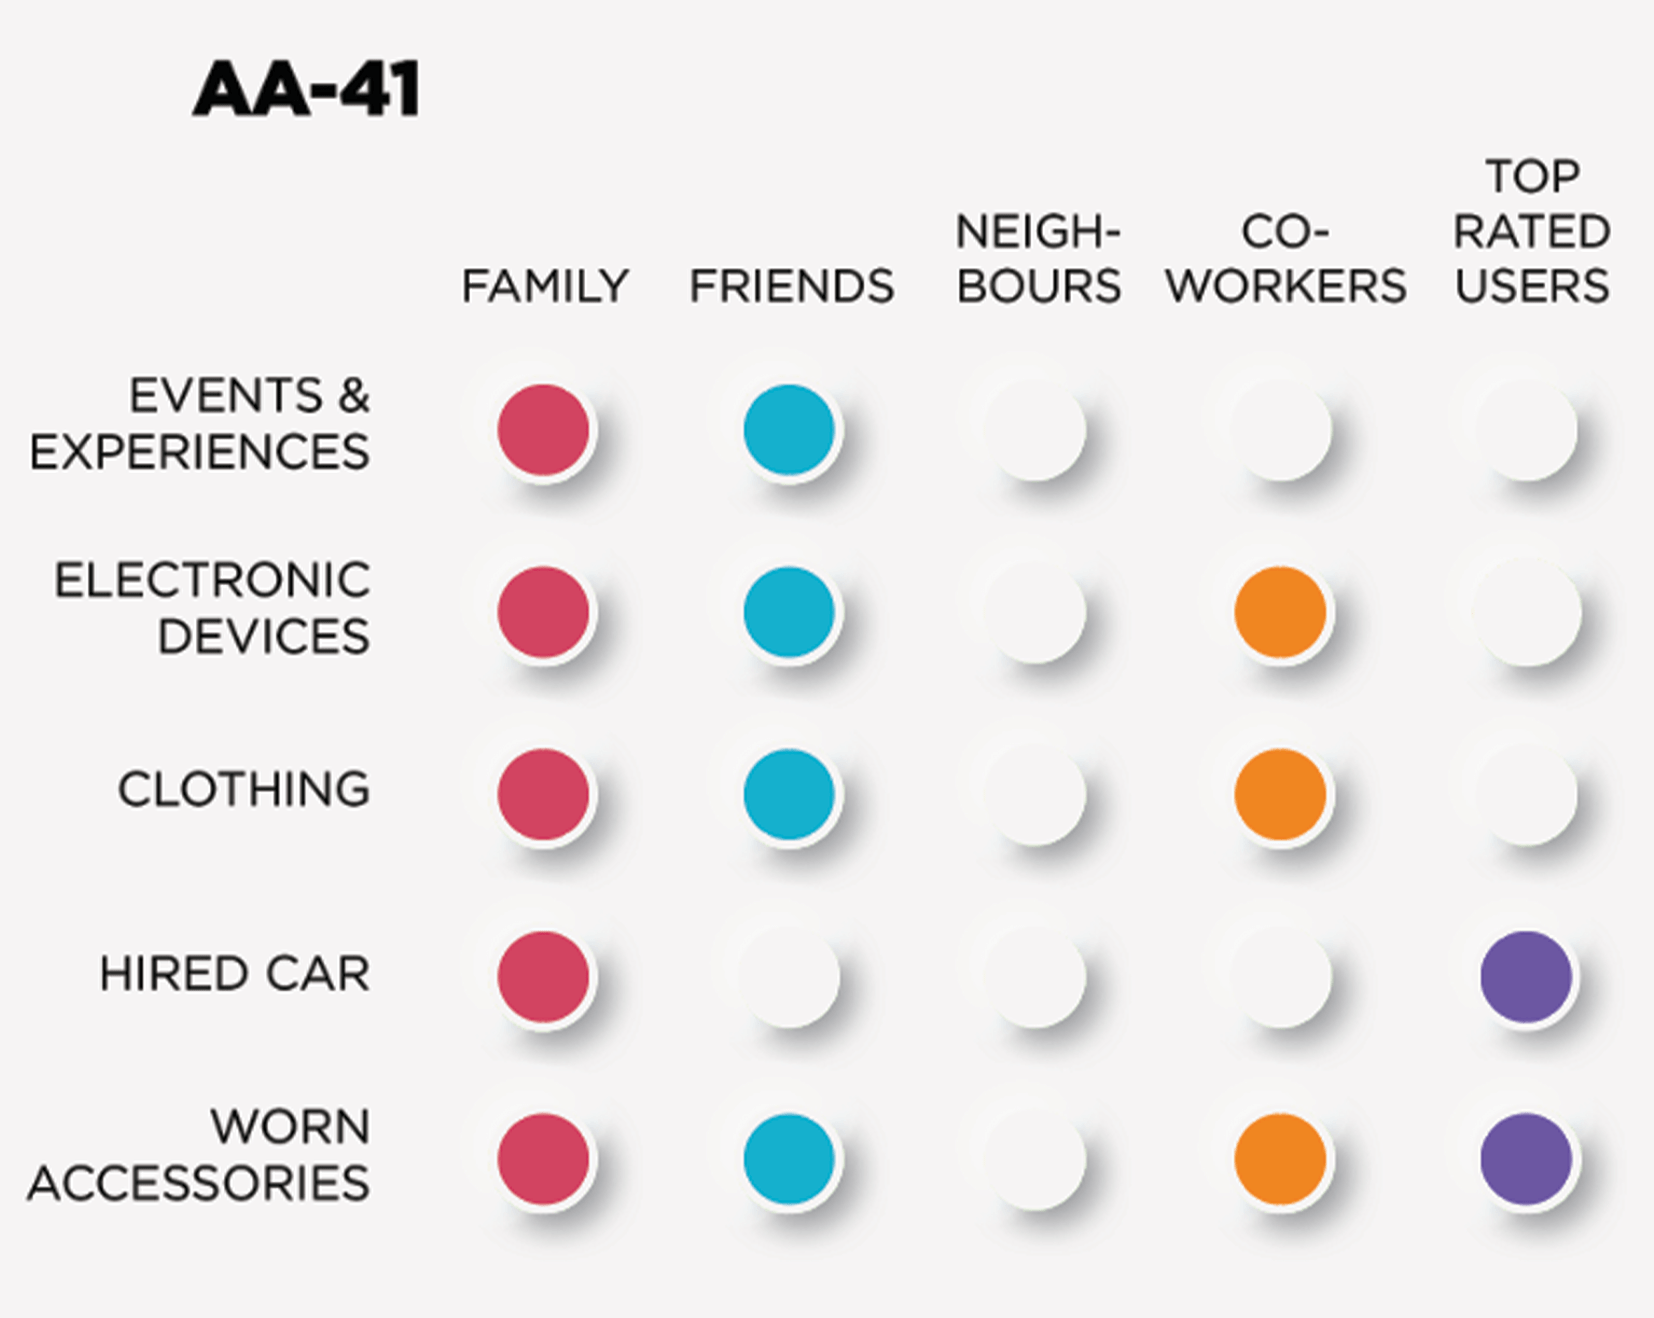
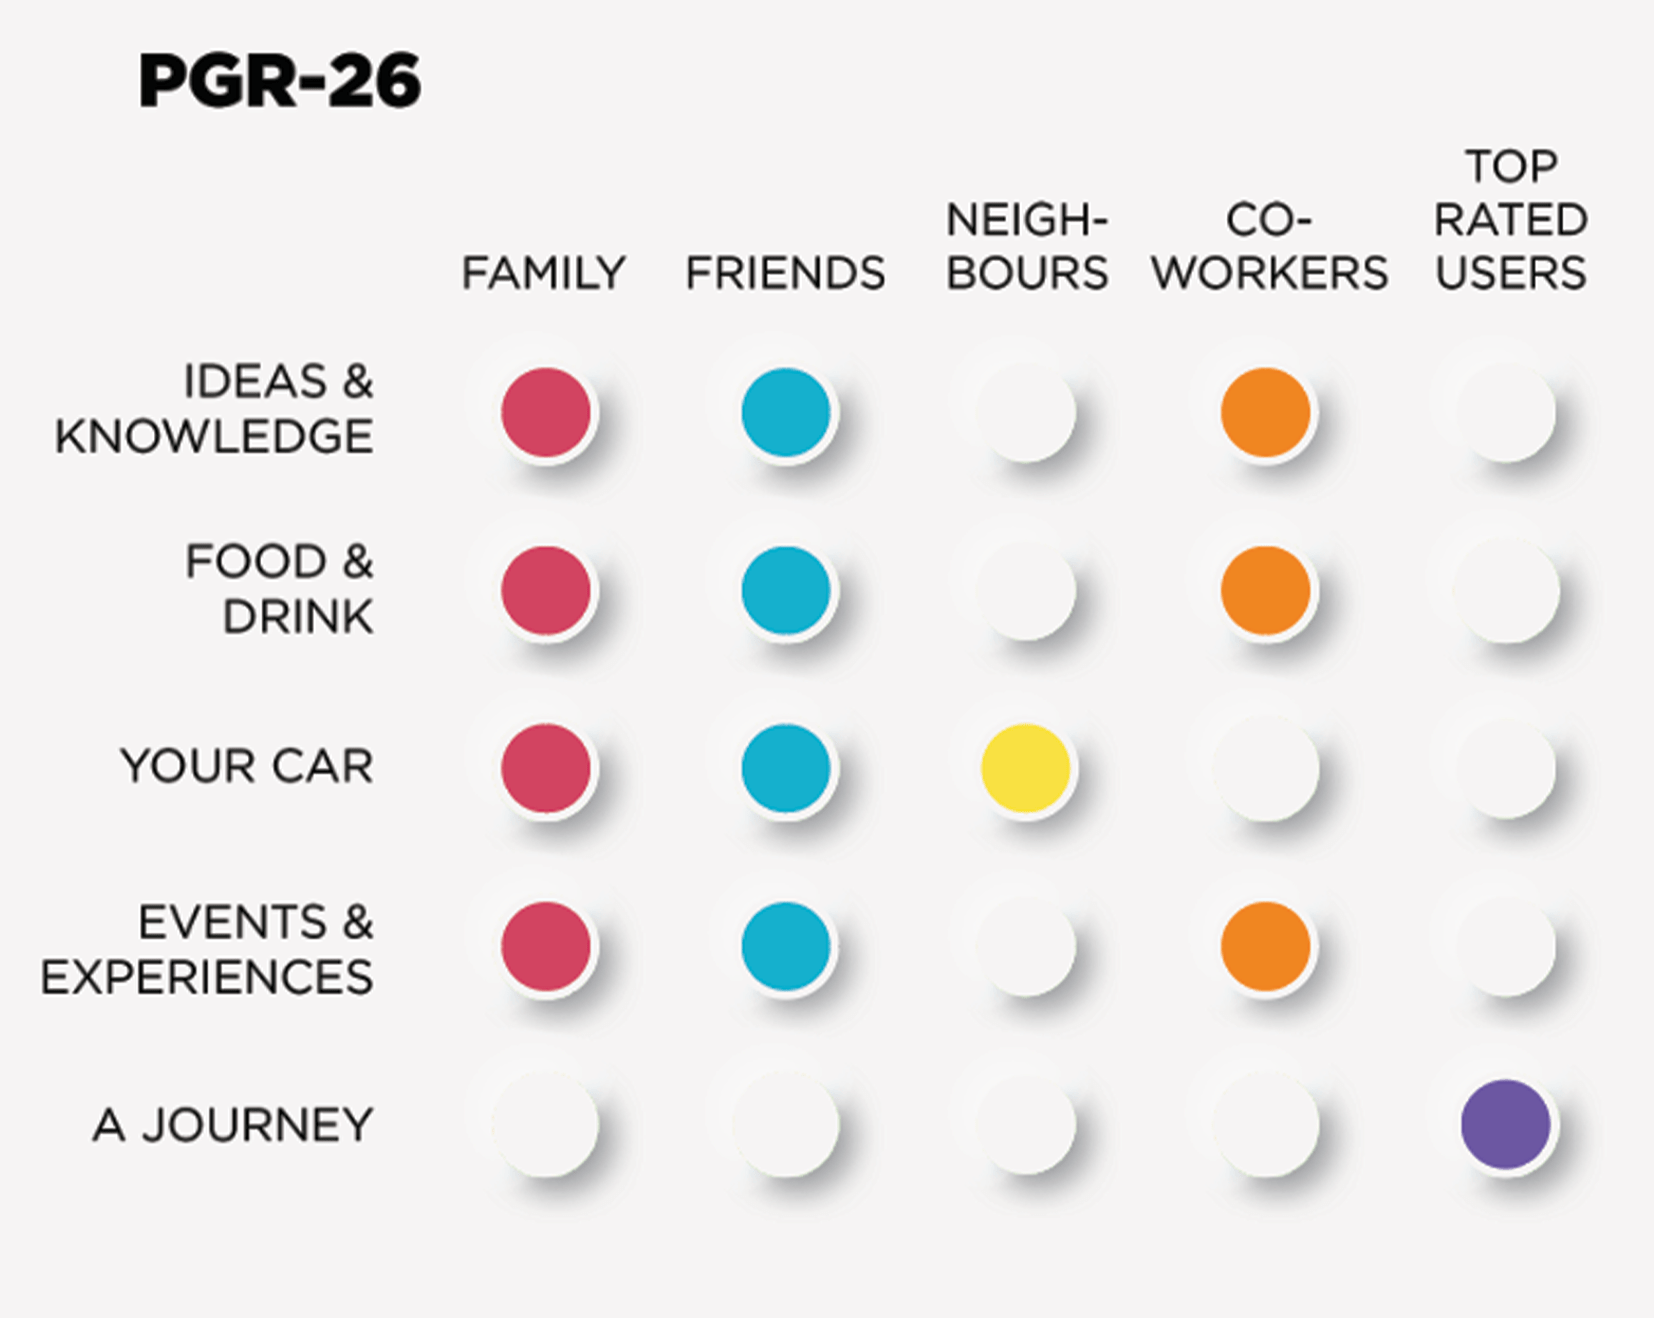
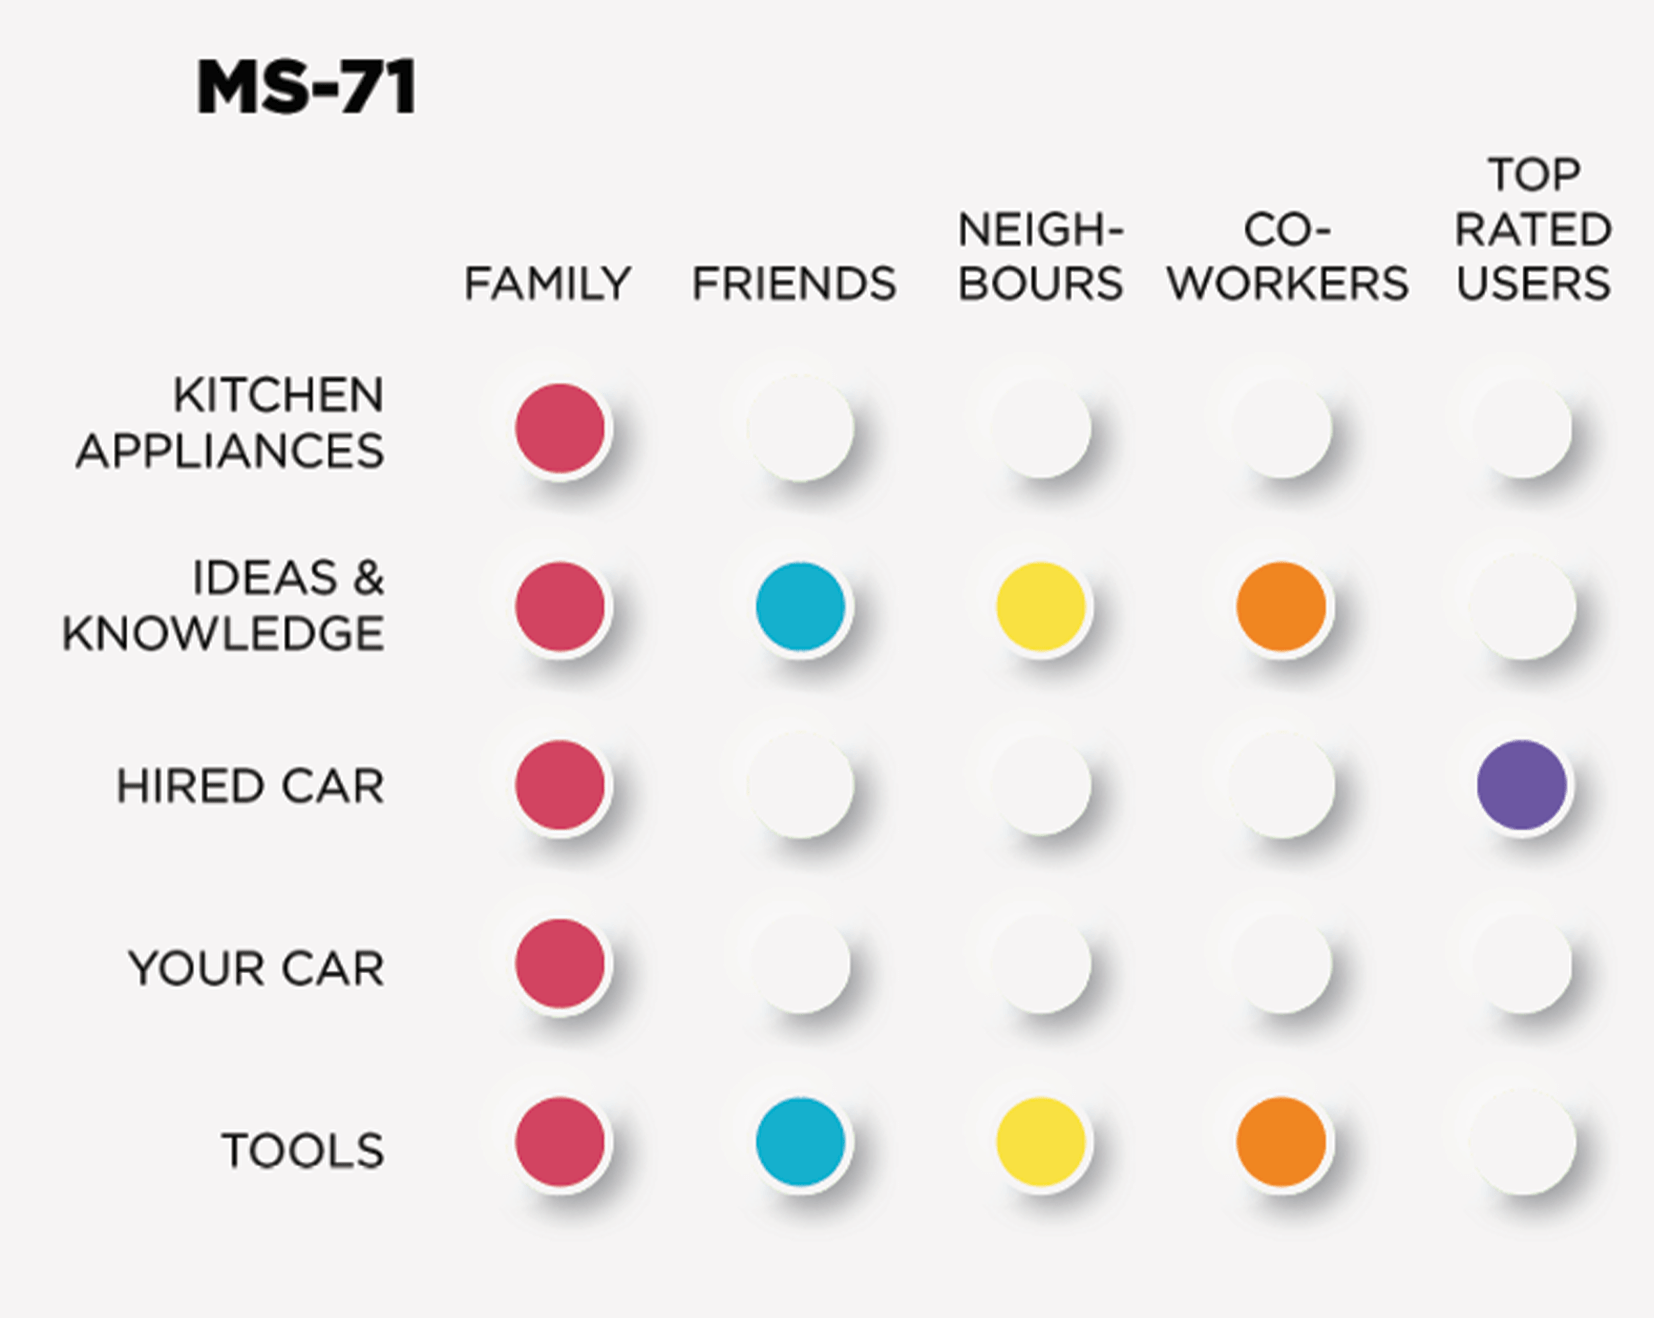
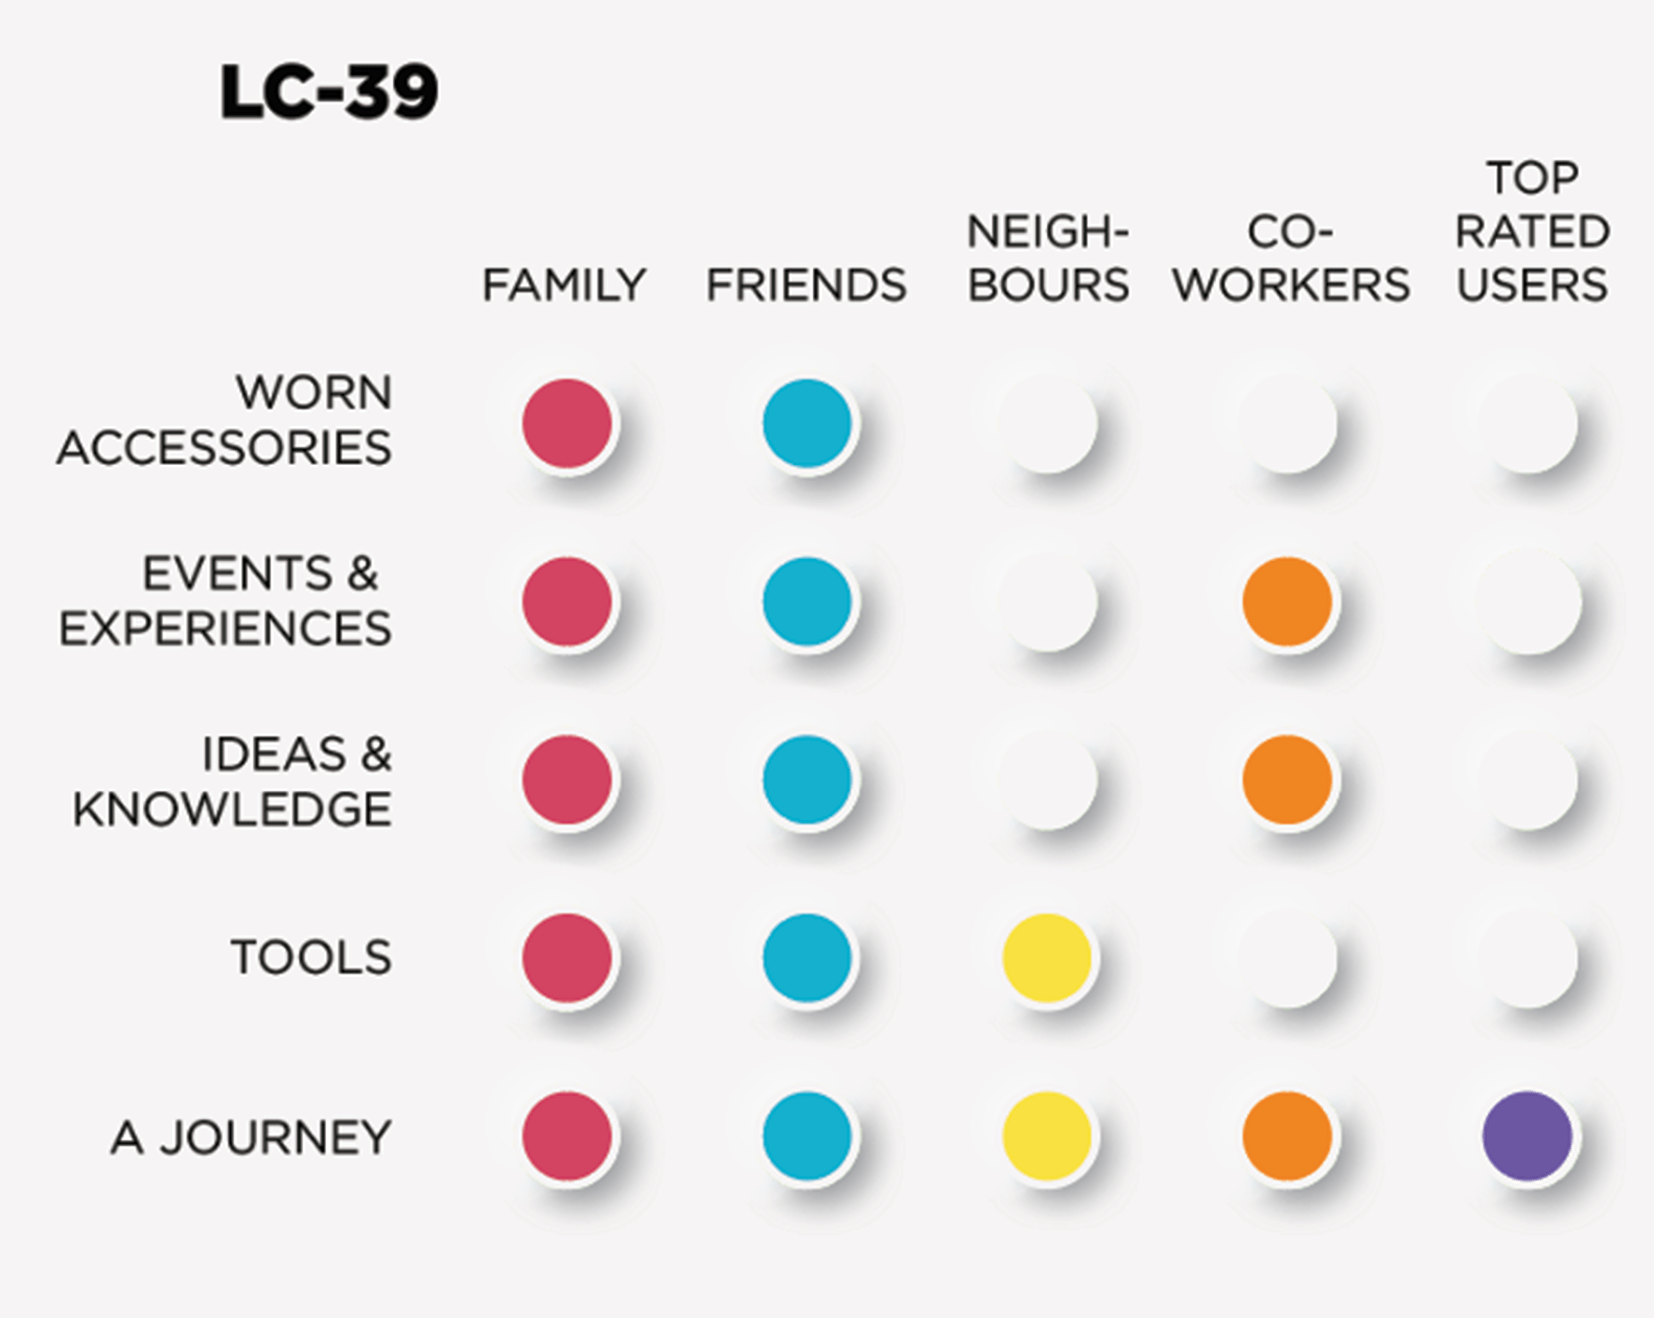
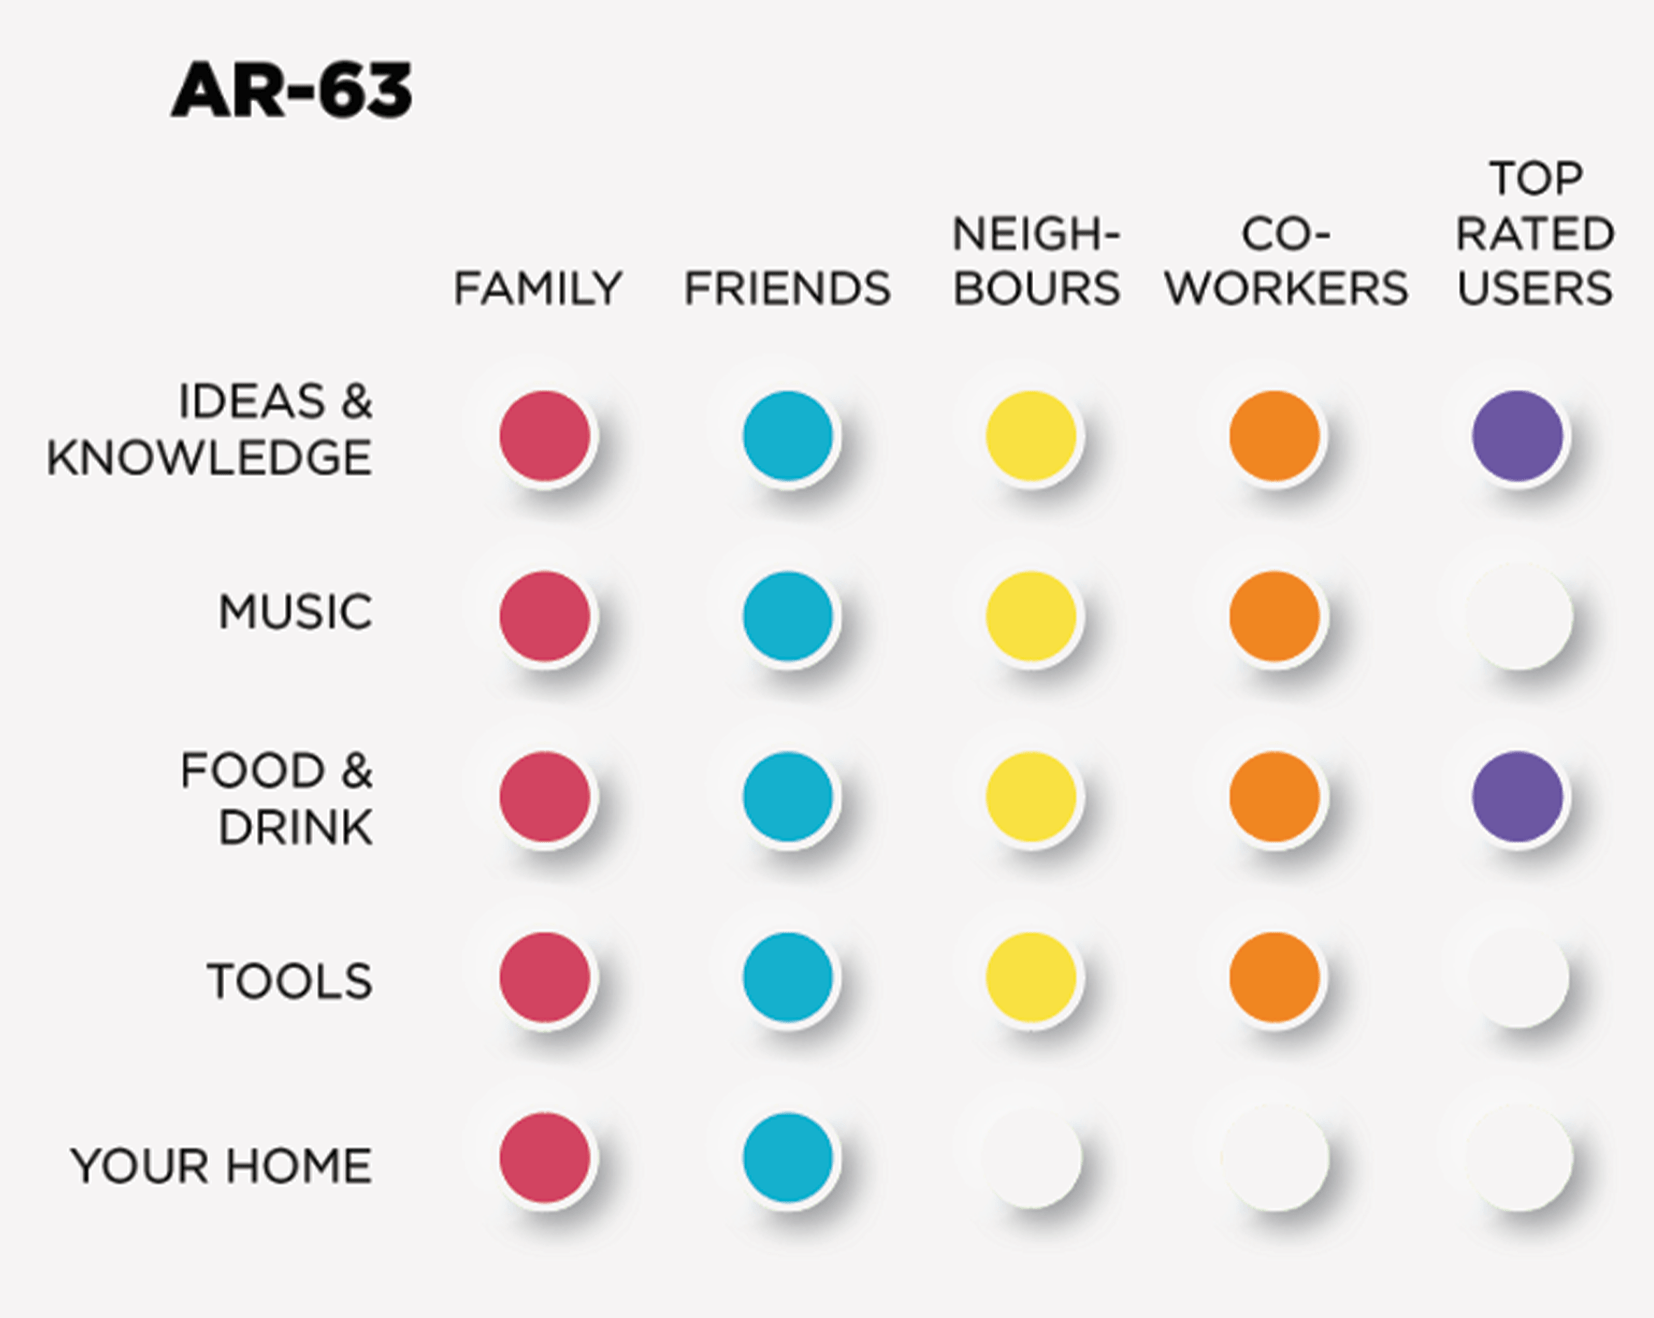
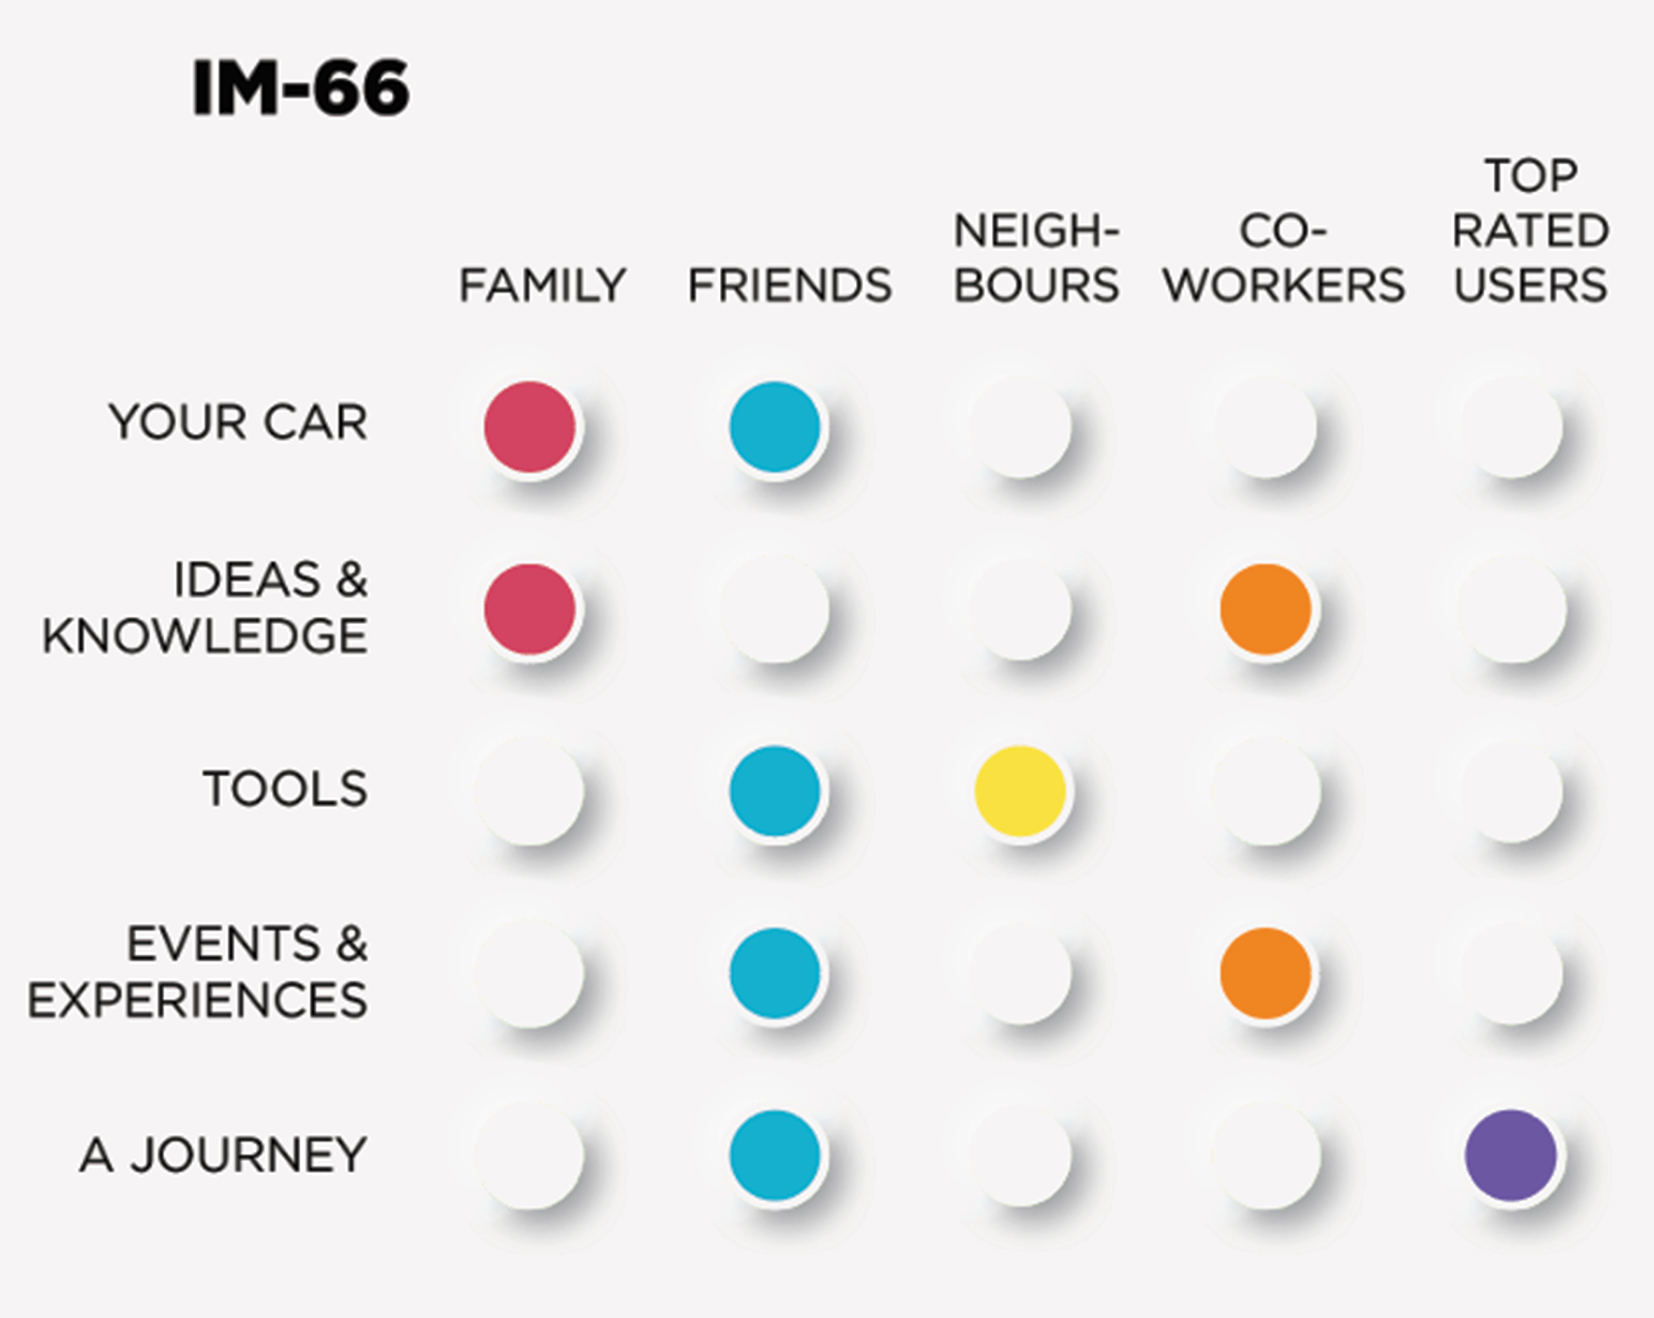
In completing the exercise to find out what possessions the participants would share and with whom, each of them indicated (Figure 18 – 32) that they trust Family and Friends with their five chosen possessions. The infographics illustrate each participant’s sharing patterns. There is a common factor within participants who would trust neighbours with their Tools. There is no correlation between age and trusting co-workers. All but one of the participants would share Ideas & Knowledge with Top-Rated Users. The more personal the possession, the less likely someone is to share with people they do not know. People trust Co-Workers, Neighbours and Top Rated Users. This gives credence to the fact that people are less likely to trust those they have less face-to-face experience with.

Fig 18. JOB-27’s sharing chart

Fig 19. LH-72’s sharing chart

Fig 20. RF-69’s sharing chart

Fig 21. KS-41’s sharing chart

Fig 22. YJ-35’s sharing chart

Fig 23. KYP-24’s sharing chart

Fig 24. KN-25’s sharing chart

Fig 25. TH-41’s sharing chart

Fig 26. AA-41’s sharing chart

Fig 27. PGR-26’s sharing chart

Fig 28. MS-71’s sharing chart

Fig 29. MM-45’s sharing chart

Fig 30. LC-39’s sharing chart

Fig 31. AR-63’s sharing chart

Fig 32. IM-66’s sharing chart

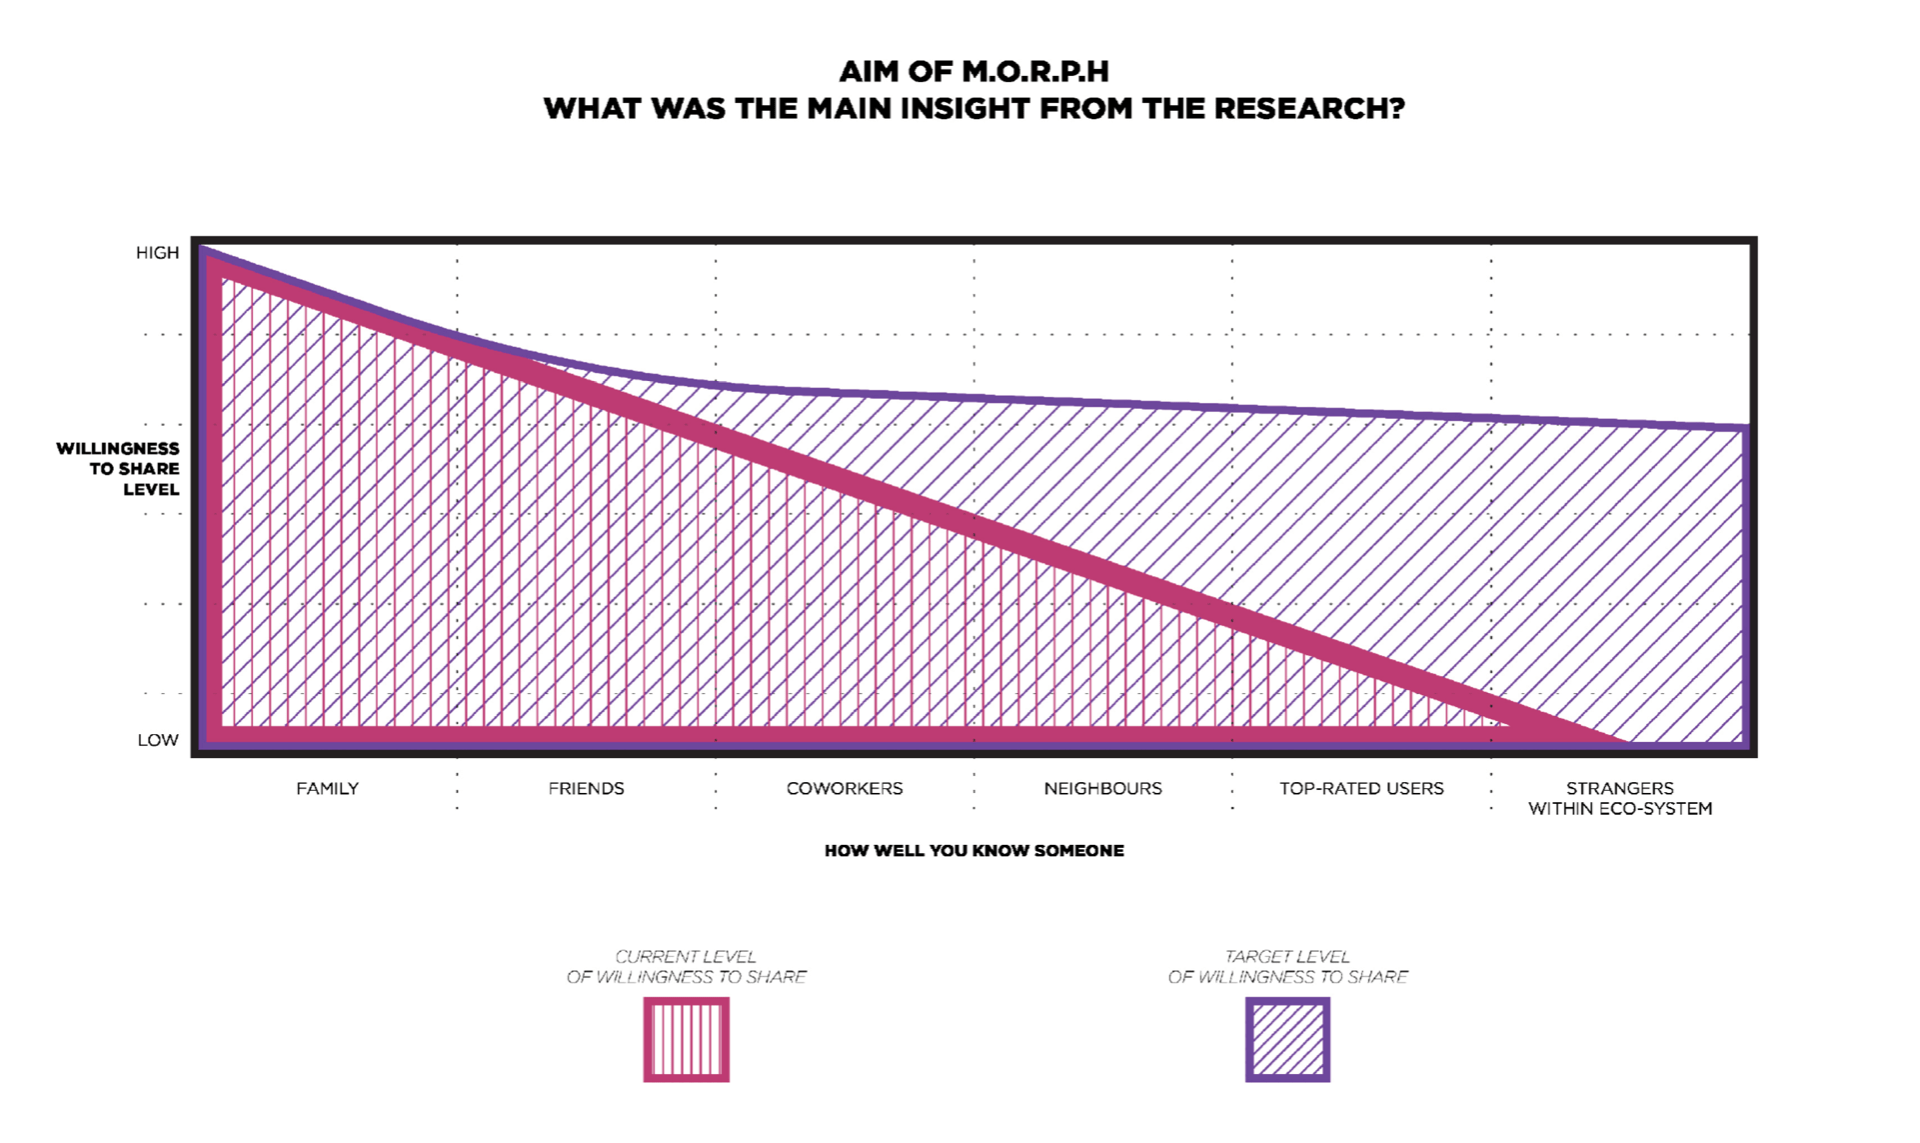
In completing the tribal maps, shown in the infographics, participants uniformly placed family and friends within circle 2. All the participants unanimously placed the top rated users outside their trust circles. Neighbours and co-workers were placed towards circle 3 or outside. The tribal circles confirm the findings from the last section, when they grouped what possessions they would share and with whom, that people trust in the order that one would expect: family first, followed by friends then co-workers, neighbours and lastly top rated users (Figure 33).

Fig 33. current vs. target levels of willingness to share

4.2.3 Journey mapping

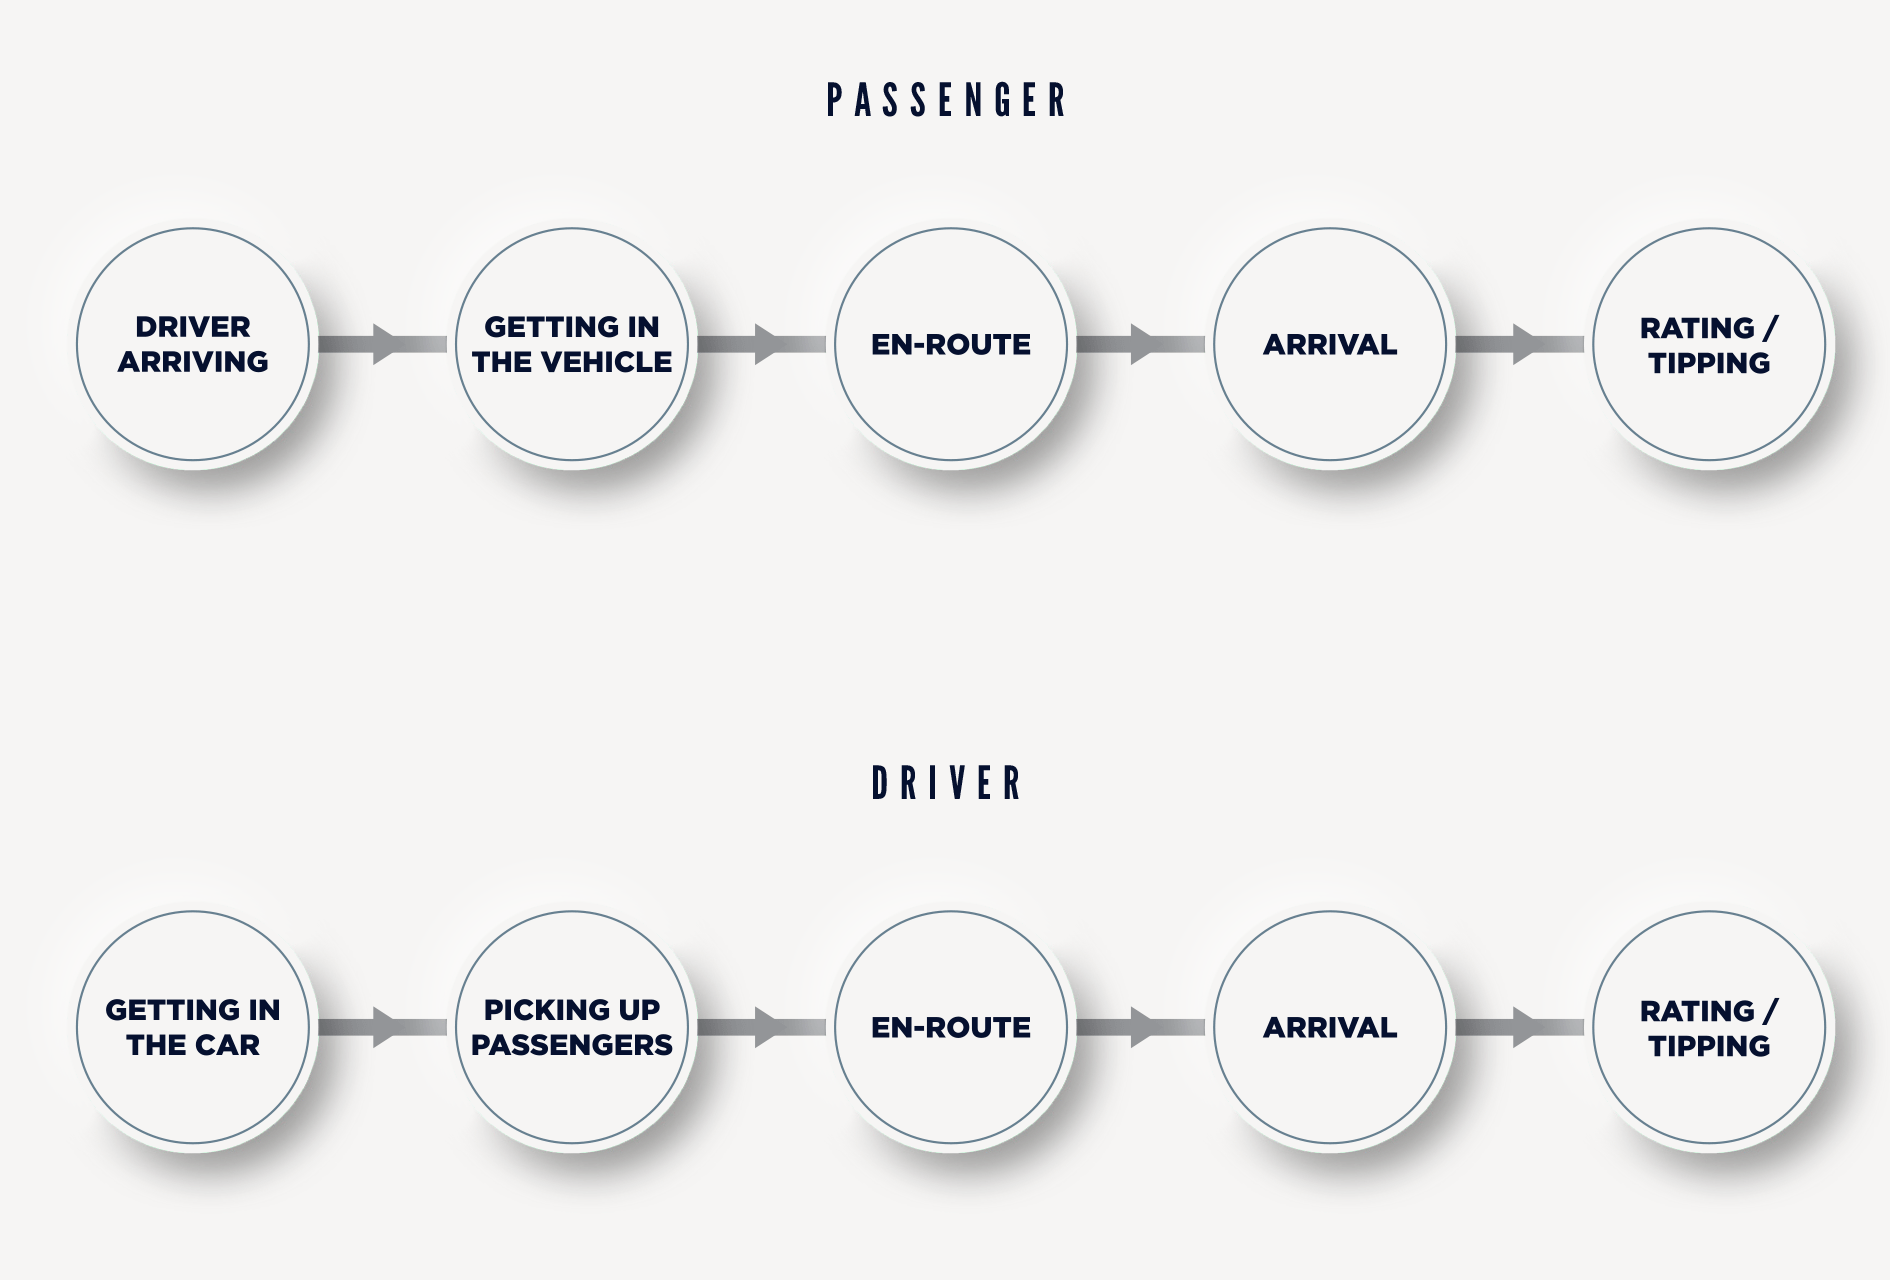
As shown in Figure 34, when mapping their journey into five key stages as a passenger in a shared vehicle service the participants’ journeys began by checking the apps for prices, comparing them, finding the availability of a vehicle and then booking it. The driver arriving, getting in the vehicle and being in it on their journey are key stages as well as arriving at their destinations, rating and tipping the driver on the app. Those who mapped an UberPool journey had smalltalk with, or the picking up of, other passengers as a stage on their journey.

Fig 34. Journey map for passenger and driver in using shared vehicle services

The participants then wrote three motivations for sharing and three barriers to sharing that they each felt were important to them. Those who were thinking about being a passenger felt barriers to sharing vehicles were not knowing who was going to be in the car with you and whether you would get on with them. But what motivated them in general was that you could relax and not have to concentrate on driving. Those who were thinking about their experiences as drivers sharing with others generally thought that the barriers were: being responsible, having to concentrate on driving and not having the same opportunity to interact with the passengers as they could, being left awake when everyone is sleeping.

Fig 35. Passenger and driver barriers and motivations in using shared vehicle services

4.3 Conclusions

One of the recurring issues concerning shared mobility was trust, both in the service provider’s systems and in people they don’t know in the vehicle. Users felt less secure about getting an Uber at night, but only women vocalised this. Regarding regulation, users questioned if the providers are regulated or are part of a scheme and wondered who is responsible legally and what legislation is there to protect them in the event of a problem. Participants expressed that their freedom to use the vehicle could be compromised as the service may not be immediately available when they need it. They were also concerned about reliability and the inconvenience of locating the vehicle or being picked up at a designated point some distance from their location. In addition, to access these services people have to share their personal data with the provider and there were concerns raised about data security and how their data was used. Participants expressed a desire to be in control and were uneasy about not having control. They were also concerned about their personal safety, this meant they were cautious and thought there were elements of risk associated with shared mobility. Interior space was another issue and users wanted enough space between themselves and others, they wanted to be able to sit where and how they preferred but felt uncomfortable asserting themselves with strangers especially if they were already in the vehicle. Communication is also important between the passengers, the driver and with the system that operates the service. The driver needs to communicate with both the passenger(s) and the system. Unfamiliar routes created a sense of anxiety in the passengers and doubt in the service provider or driver. This was increased when various apps gave different data points, creating confusion and conflict.

What we found interesting from the results of the literature review, online surveys and user workshops was how vehicles could be designed to better accommodate different stranger-sharing scenarios and support the diverse requirements of family members at different stages of their lives.

< Previous Chapter: Methodology

Next Chapter: Design Concepts (NANO) >

What does “MORPH” mean to you? We’d love to hear from you. Share your story on LinkedIn or on Twitter @RCA_IMDC.

To access the full report, please enter your details below.

This helps us understand the impact of our research. Your information will not be shared with third parties.

MASTER Report Download Form

This form is protected by reCAPTCHA and the Google Privacy Policy and Terms of Service apply.

Research Team and Acknowledgement

The MORPH core research team includes Dr. Jiayu Wu, Dr. Sheila Clark, Ashley Kennard, Daniel Quinlan, Katrine Hesseldahl and Sam Johnson. The service designers are Hyojin Bae and Nayoon Lee. The concept designers are Patryk Musielak (NANO), YoungJae Kim (MOSEY), Jiaheng Wei (ENROUTE) and Dinesh Raman (SPAREVROOM). 

MORPH was sponsored by Hyundai-Kia. The financial support enabled the Intelligent Mobility Design Centre of the Royal College of Art to conceive and explore new areas in transport experiences, vehicle design, digital technology integration, mobility systems and other research topics. We would like to thank Hyundai Motor’s German and Korean offices for their involvement in feedback and review during the research.

Special thanks to Dr. Cyriel Diels, Professor Stephen Boyd Davis and Professor Dale Harrow for reviewing and providing feedback during the research and for the final report.

Finally a special thank you to William Renel for designing the MORPH website, Jane Savory, Hannah Adeuya and Lulu Ishaq for managing the finance and logistics.

Launched in 2016 at the Royal College of Art, the Intelligent Mobility Design Centre (IMDC) leads research at the intersection of people, mobility and technology within a complex and changing urban and global environment.

The Royal College of Art is ranked the No. 1 art and design university by the QS World University Rankings, 2021.

© 2021 Royal College of Art